Immigrants from South Eastern Asia vs Immigrants from Portugal Family Households
COMPARE
Immigrants from South Eastern Asia
Immigrants from Portugal
Family Households
Family Households Comparison
Immigrants from South Eastern Asia
Immigrants from Portugal
67.5%
FAMILY HOUSEHOLDS
100.0/ 100
METRIC RATING
24th/ 347
METRIC RANK
65.2%
FAMILY HOUSEHOLDS
98.6/ 100
METRIC RATING
95th/ 347
METRIC RANK
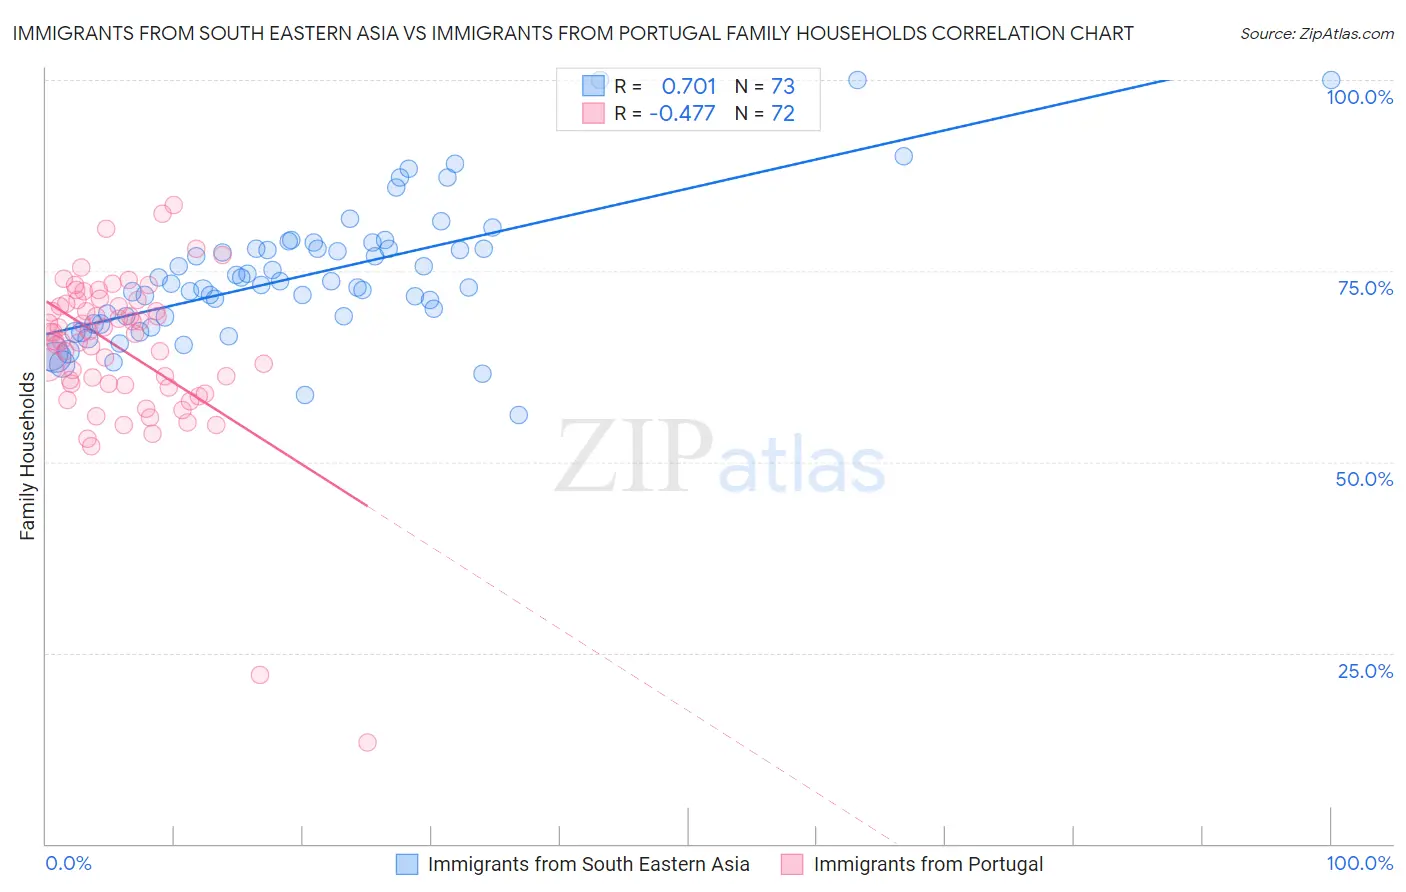
Immigrants from South Eastern Asia vs Immigrants from Portugal Family Households Correlation Chart
The statistical analysis conducted on geographies consisting of 512,232,151 people shows a strong positive correlation between the proportion of Immigrants from South Eastern Asia and percentage of family households in the United States with a correlation coefficient (R) of 0.701 and weighted average of 67.5%. Similarly, the statistical analysis conducted on geographies consisting of 174,766,633 people shows a moderate negative correlation between the proportion of Immigrants from Portugal and percentage of family households in the United States with a correlation coefficient (R) of -0.477 and weighted average of 65.2%, a difference of 3.5%.
Family Households Correlation Summary
| Measurement | Immigrants from South Eastern Asia | Immigrants from Portugal |
| Minimum | 56.2% | 13.2% |
| Maximum | 100.0% | 83.6% |
| Range | 43.8% | 70.4% |
| Mean | 74.5% | 64.7% |
| Median | 73.4% | 66.8% |
| Interquartile 25% (IQ1) | 68.5% | 60.1% |
| Interquartile 75% (IQ3) | 78.0% | 70.5% |
| Interquartile Range (IQR) | 9.4% | 10.4% |
| Standard Deviation (Sample) | 8.8% | 10.7% |
| Standard Deviation (Population) | 8.7% | 10.6% |
Similar Demographics by Family Households
Demographics Similar to Immigrants from South Eastern Asia by Family Households
In terms of family households, the demographic groups most similar to Immigrants from South Eastern Asia are Immigrants from Nicaragua (67.5%, a difference of 0.020%), Immigrants from India (67.4%, a difference of 0.040%), Hispanic or Latino (67.4%, a difference of 0.080%), Hawaiian (67.4%, a difference of 0.090%), and Nicaraguan (67.4%, a difference of 0.16%).
| Demographics | Rating | Rank | Family Households |
| Chinese | 100.0 /100 | #17 | Exceptional 68.1% |
| Immigrants | Taiwan | 100.0 /100 | #18 | Exceptional 68.0% |
| Samoans | 100.0 /100 | #19 | Exceptional 67.9% |
| Inupiat | 100.0 /100 | #20 | Exceptional 67.8% |
| Cubans | 100.0 /100 | #21 | Exceptional 67.7% |
| Sri Lankans | 100.0 /100 | #22 | Exceptional 67.7% |
| Immigrants | Pakistan | 100.0 /100 | #23 | Exceptional 67.7% |
| Immigrants | South Eastern Asia | 100.0 /100 | #24 | Exceptional 67.5% |
| Immigrants | Nicaragua | 100.0 /100 | #25 | Exceptional 67.5% |
| Immigrants | India | 100.0 /100 | #26 | Exceptional 67.4% |
| Hispanics or Latinos | 100.0 /100 | #27 | Exceptional 67.4% |
| Hawaiians | 100.0 /100 | #28 | Exceptional 67.4% |
| Nicaraguans | 100.0 /100 | #29 | Exceptional 67.4% |
| Immigrants | Peru | 100.0 /100 | #30 | Exceptional 67.2% |
| Immigrants | Latin America | 100.0 /100 | #31 | Exceptional 67.2% |
Demographics Similar to Immigrants from Portugal by Family Households
In terms of family households, the demographic groups most similar to Immigrants from Portugal are Swiss (65.2%, a difference of 0.010%), Guatemalan (65.2%, a difference of 0.010%), Immigrants from Poland (65.2%, a difference of 0.030%), Guyanese (65.3%, a difference of 0.040%), and Hopi (65.3%, a difference of 0.050%).
| Demographics | Rating | Rank | Family Households |
| Immigrants | Haiti | 99.1 /100 | #88 | Exceptional 65.3% |
| Immigrants | Caribbean | 99.1 /100 | #89 | Exceptional 65.3% |
| Immigrants | Laos | 99.1 /100 | #90 | Exceptional 65.3% |
| Crow | 98.9 /100 | #91 | Exceptional 65.3% |
| Hopi | 98.8 /100 | #92 | Exceptional 65.3% |
| Guyanese | 98.8 /100 | #93 | Exceptional 65.3% |
| Immigrants | Poland | 98.7 /100 | #94 | Exceptional 65.2% |
| Immigrants | Portugal | 98.6 /100 | #95 | Exceptional 65.2% |
| Swiss | 98.6 /100 | #96 | Exceptional 65.2% |
| Guatemalans | 98.6 /100 | #97 | Exceptional 65.2% |
| Immigrants | Syria | 98.4 /100 | #98 | Exceptional 65.2% |
| Central American Indians | 98.3 /100 | #99 | Exceptional 65.2% |
| Haitians | 98.1 /100 | #100 | Exceptional 65.2% |
| Chileans | 98.1 /100 | #101 | Exceptional 65.2% |
| Immigrants | Sri Lanka | 98.0 /100 | #102 | Exceptional 65.1% |