Yugoslavian vs Immigrants from Portugal College, Under 1 year
COMPARE
Yugoslavian
Immigrants from Portugal
College, Under 1 year
College, Under 1 year Comparison
Yugoslavians
Immigrants from Portugal
65.6%
COLLEGE, UNDER 1 YEAR
55.7/ 100
METRIC RATING
169th/ 347
METRIC RANK
57.7%
COLLEGE, UNDER 1 YEAR
0.0/ 100
METRIC RATING
306th/ 347
METRIC RANK
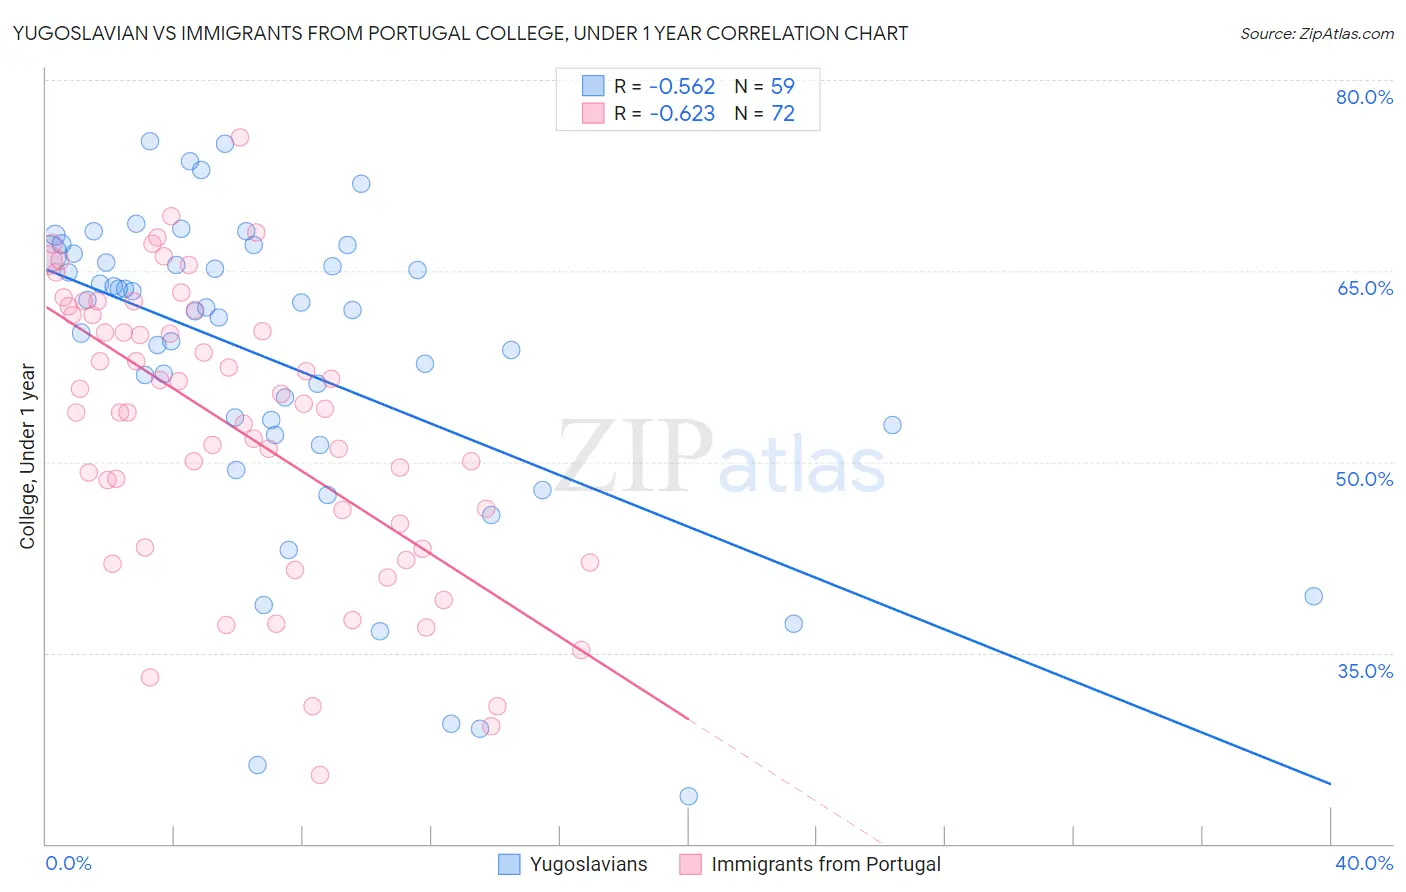
Yugoslavian vs Immigrants from Portugal College, Under 1 year Correlation Chart
The statistical analysis conducted on geographies consisting of 285,723,201 people shows a substantial negative correlation between the proportion of Yugoslavians and percentage of population with at least college, under 1 year education in the United States with a correlation coefficient (R) of -0.562 and weighted average of 65.6%. Similarly, the statistical analysis conducted on geographies consisting of 174,792,047 people shows a significant negative correlation between the proportion of Immigrants from Portugal and percentage of population with at least college, under 1 year education in the United States with a correlation coefficient (R) of -0.623 and weighted average of 57.7%, a difference of 13.7%.
College, Under 1 year Correlation Summary
| Measurement | Yugoslavian | Immigrants from Portugal |
| Minimum | 23.8% | 25.4% |
| Maximum | 75.2% | 75.4% |
| Range | 51.5% | 50.1% |
| Mean | 57.7% | 52.8% |
| Median | 61.9% | 54.4% |
| Interquartile 25% (IQ1) | 52.1% | 44.2% |
| Interquartile 75% (IQ3) | 66.3% | 61.8% |
| Interquartile Range (IQR) | 14.2% | 17.6% |
| Standard Deviation (Sample) | 12.5% | 11.2% |
| Standard Deviation (Population) | 12.3% | 11.1% |
Similar Demographics by College, Under 1 year
Demographics Similar to Yugoslavians by College, Under 1 year
In terms of college, under 1 year, the demographic groups most similar to Yugoslavians are German (65.6%, a difference of 0.0%), Hungarian (65.6%, a difference of 0.010%), Immigrants from Somalia (65.6%, a difference of 0.030%), Immigrants from Oceania (65.6%, a difference of 0.030%), and Moroccan (65.6%, a difference of 0.040%).
| Demographics | Rating | Rank | College, Under 1 year |
| Koreans | 65.3 /100 | #162 | Good 65.9% |
| Somalis | 62.7 /100 | #163 | Good 65.8% |
| Czechoslovakians | 62.6 /100 | #164 | Good 65.8% |
| Immigrants | Uzbekistan | 61.6 /100 | #165 | Good 65.8% |
| Moroccans | 56.7 /100 | #166 | Average 65.6% |
| Immigrants | Somalia | 56.4 /100 | #167 | Average 65.6% |
| Hungarians | 55.9 /100 | #168 | Average 65.6% |
| Yugoslavians | 55.7 /100 | #169 | Average 65.6% |
| Germans | 55.7 /100 | #170 | Average 65.6% |
| Immigrants | Oceania | 55.0 /100 | #171 | Average 65.6% |
| South American Indians | 54.4 /100 | #172 | Average 65.5% |
| Swiss | 53.9 /100 | #173 | Average 65.5% |
| Immigrants | Bosnia and Herzegovina | 50.0 /100 | #174 | Average 65.4% |
| Scotch-Irish | 49.5 /100 | #175 | Average 65.4% |
| French | 48.9 /100 | #176 | Average 65.4% |
Demographics Similar to Immigrants from Portugal by College, Under 1 year
In terms of college, under 1 year, the demographic groups most similar to Immigrants from Portugal are Fijian (57.7%, a difference of 0.010%), Central American (57.7%, a difference of 0.010%), Immigrants from Nicaragua (57.6%, a difference of 0.14%), Haitian (57.8%, a difference of 0.20%), and Kiowa (57.8%, a difference of 0.31%).
| Demographics | Rating | Rank | College, Under 1 year |
| Cubans | 0.0 /100 | #299 | Tragic 58.6% |
| Immigrants | Guyana | 0.0 /100 | #300 | Tragic 58.5% |
| Mexican American Indians | 0.0 /100 | #301 | Tragic 58.1% |
| Apache | 0.0 /100 | #302 | Tragic 58.0% |
| Immigrants | Dominica | 0.0 /100 | #303 | Tragic 57.9% |
| Kiowa | 0.0 /100 | #304 | Tragic 57.8% |
| Haitians | 0.0 /100 | #305 | Tragic 57.8% |
| Immigrants | Portugal | 0.0 /100 | #306 | Tragic 57.7% |
| Fijians | 0.0 /100 | #307 | Tragic 57.7% |
| Central Americans | 0.0 /100 | #308 | Tragic 57.7% |
| Immigrants | Nicaragua | 0.0 /100 | #309 | Tragic 57.6% |
| Pueblo | 0.0 /100 | #310 | Tragic 57.4% |
| Cajuns | 0.0 /100 | #311 | Tragic 57.3% |
| Salvadorans | 0.0 /100 | #312 | Tragic 57.3% |
| Dutch West Indians | 0.0 /100 | #313 | Tragic 57.2% |