Yugoslavian vs Immigrants from West Indies Family Households
COMPARE
Yugoslavian
Immigrants from West Indies
Family Households
Family Households Comparison
Yugoslavians
Immigrants from West Indies
63.1%
FAMILY HOUSEHOLDS
0.4/ 100
METRIC RATING
269th/ 347
METRIC RANK
61.6%
FAMILY HOUSEHOLDS
0.0/ 100
METRIC RATING
324th/ 347
METRIC RANK
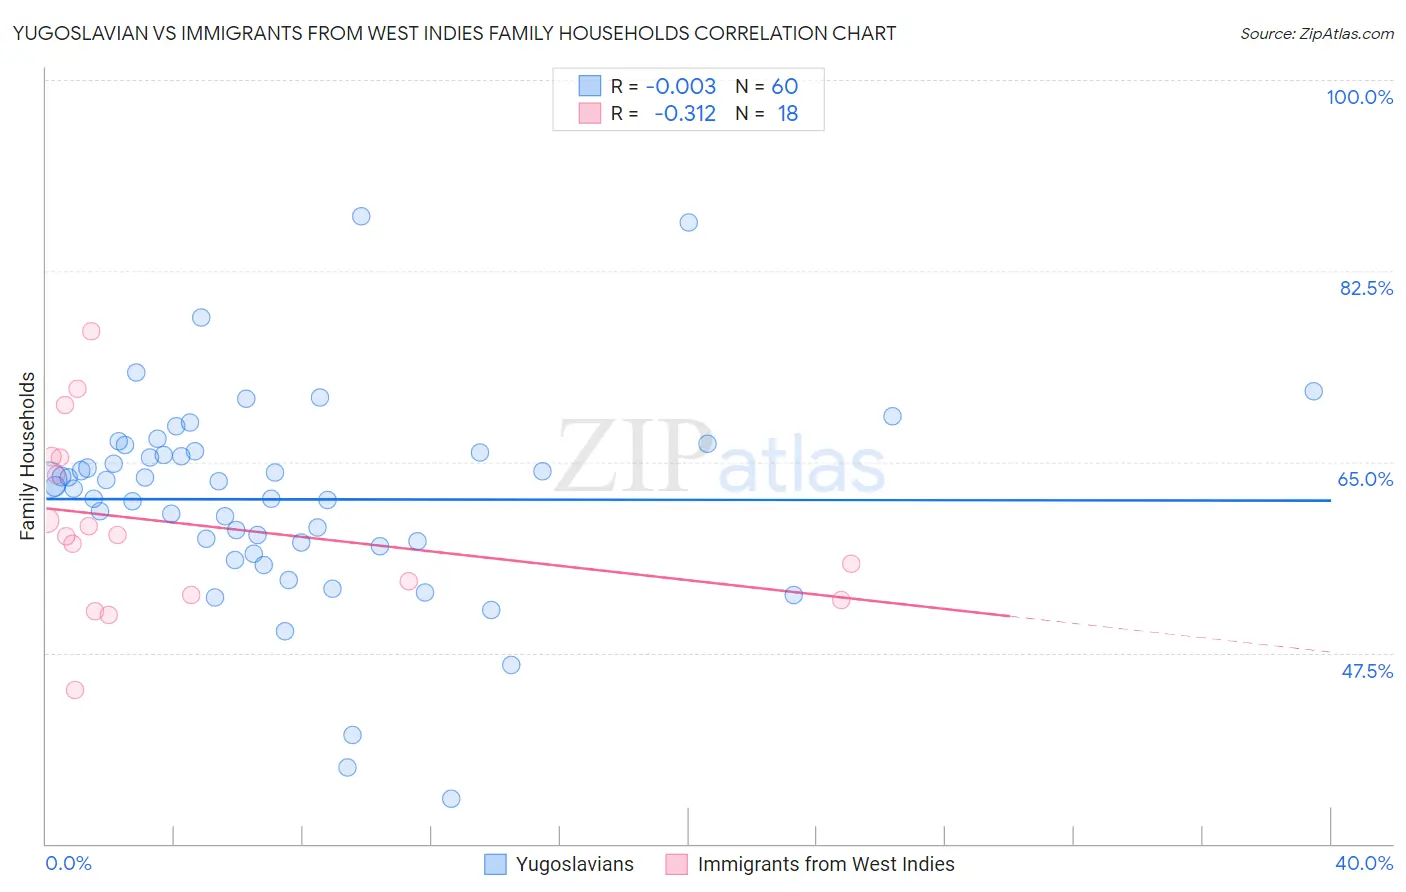
Yugoslavian vs Immigrants from West Indies Family Households Correlation Chart
The statistical analysis conducted on geographies consisting of 285,640,029 people shows no correlation between the proportion of Yugoslavians and percentage of family households in the United States with a correlation coefficient (R) of -0.003 and weighted average of 63.1%. Similarly, the statistical analysis conducted on geographies consisting of 72,452,456 people shows a mild negative correlation between the proportion of Immigrants from West Indies and percentage of family households in the United States with a correlation coefficient (R) of -0.312 and weighted average of 61.6%, a difference of 2.4%.
Family Households Correlation Summary
| Measurement | Yugoslavian | Immigrants from West Indies |
| Minimum | 34.1% | 44.1% |
| Maximum | 87.5% | 77.0% |
| Range | 53.4% | 32.9% |
| Mean | 61.6% | 59.3% |
| Median | 62.9% | 58.3% |
| Interquartile 25% (IQ1) | 57.5% | 52.8% |
| Interquartile 75% (IQ3) | 65.9% | 65.4% |
| Interquartile Range (IQR) | 8.5% | 12.5% |
| Standard Deviation (Sample) | 9.4% | 8.3% |
| Standard Deviation (Population) | 9.4% | 8.1% |
Similar Demographics by Family Households
Demographics Similar to Yugoslavians by Family Households
In terms of family households, the demographic groups most similar to Yugoslavians are Immigrants from Singapore (63.1%, a difference of 0.0%), Immigrants from Austria (63.1%, a difference of 0.020%), Immigrants from Croatia (63.1%, a difference of 0.030%), Immigrants from Turkey (63.1%, a difference of 0.030%), and Immigrants from Kazakhstan (63.1%, a difference of 0.040%).
| Demographics | Rating | Rank | Family Households |
| Immigrants | Ireland | 0.6 /100 | #262 | Tragic 63.2% |
| Cheyenne | 0.5 /100 | #263 | Tragic 63.2% |
| Kenyans | 0.5 /100 | #264 | Tragic 63.2% |
| Colville | 0.5 /100 | #265 | Tragic 63.2% |
| Immigrants | Western Africa | 0.5 /100 | #266 | Tragic 63.1% |
| Israelis | 0.4 /100 | #267 | Tragic 63.1% |
| Immigrants | Singapore | 0.4 /100 | #268 | Tragic 63.1% |
| Yugoslavians | 0.4 /100 | #269 | Tragic 63.1% |
| Immigrants | Austria | 0.3 /100 | #270 | Tragic 63.1% |
| Immigrants | Croatia | 0.3 /100 | #271 | Tragic 63.1% |
| Immigrants | Turkey | 0.3 /100 | #272 | Tragic 63.1% |
| Immigrants | Kazakhstan | 0.3 /100 | #273 | Tragic 63.1% |
| Lumbee | 0.3 /100 | #274 | Tragic 63.1% |
| West Indians | 0.3 /100 | #275 | Tragic 63.1% |
| Serbians | 0.3 /100 | #276 | Tragic 63.0% |
Demographics Similar to Immigrants from West Indies by Family Households
In terms of family households, the demographic groups most similar to Immigrants from West Indies are Immigrants from Serbia (61.6%, a difference of 0.010%), Tlingit-Haida (61.6%, a difference of 0.010%), Immigrants from Switzerland (61.6%, a difference of 0.010%), Alsatian (61.7%, a difference of 0.10%), and Ugandan (61.7%, a difference of 0.16%).
| Demographics | Rating | Rank | Family Households |
| Immigrants | Bosnia and Herzegovina | 0.0 /100 | #317 | Tragic 61.9% |
| Alaskan Athabascans | 0.0 /100 | #318 | Tragic 61.8% |
| Cape Verdeans | 0.0 /100 | #319 | Tragic 61.8% |
| Ugandans | 0.0 /100 | #320 | Tragic 61.7% |
| Alsatians | 0.0 /100 | #321 | Tragic 61.7% |
| Immigrants | Serbia | 0.0 /100 | #322 | Tragic 61.6% |
| Tlingit-Haida | 0.0 /100 | #323 | Tragic 61.6% |
| Immigrants | West Indies | 0.0 /100 | #324 | Tragic 61.6% |
| Immigrants | Switzerland | 0.0 /100 | #325 | Tragic 61.6% |
| Indonesians | 0.0 /100 | #326 | Tragic 61.5% |
| Blacks/African Americans | 0.0 /100 | #327 | Tragic 61.5% |
| Kiowa | 0.0 /100 | #328 | Tragic 61.4% |
| Cambodians | 0.0 /100 | #329 | Tragic 61.4% |
| Immigrants | Australia | 0.0 /100 | #330 | Tragic 61.3% |
| Immigrants | France | 0.0 /100 | #331 | Tragic 61.3% |