Norwegian vs U.S. Virgin Islander Divorced or Separated
COMPARE
Norwegian
U.S. Virgin Islander
Divorced or Separated
Divorced or Separated Comparison
Norwegians
U.S. Virgin Islanders
12.1%
DIVORCED OR SEPARATED
33.2/ 100
METRIC RATING
192nd/ 347
METRIC RANK
13.4%
DIVORCED OR SEPARATED
0.0/ 100
METRIC RATING
323rd/ 347
METRIC RANK
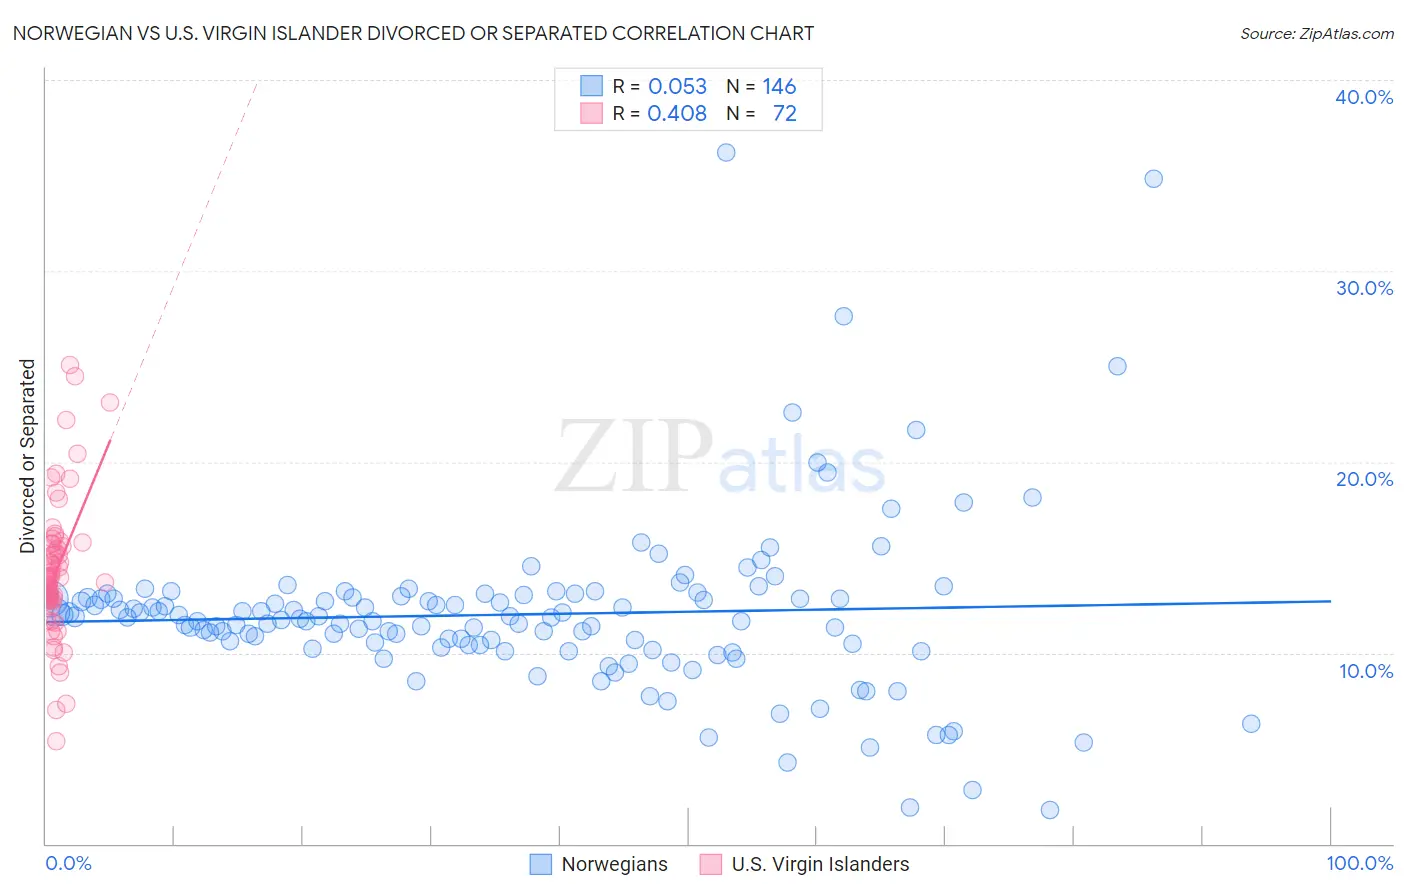
Norwegian vs U.S. Virgin Islander Divorced or Separated Correlation Chart
The statistical analysis conducted on geographies consisting of 533,039,037 people shows a slight positive correlation between the proportion of Norwegians and percentage of population currently divorced or separated in the United States with a correlation coefficient (R) of 0.053 and weighted average of 12.1%. Similarly, the statistical analysis conducted on geographies consisting of 87,523,386 people shows a moderate positive correlation between the proportion of U.S. Virgin Islanders and percentage of population currently divorced or separated in the United States with a correlation coefficient (R) of 0.408 and weighted average of 13.4%, a difference of 10.8%.
Divorced or Separated Correlation Summary
| Measurement | Norwegian | U.S. Virgin Islander |
| Minimum | 1.8% | 5.4% |
| Maximum | 36.2% | 25.1% |
| Range | 34.4% | 19.7% |
| Mean | 12.0% | 14.2% |
| Median | 11.8% | 14.0% |
| Interquartile 25% (IQ1) | 10.4% | 12.8% |
| Interquartile 75% (IQ3) | 12.9% | 15.7% |
| Interquartile Range (IQR) | 2.5% | 2.9% |
| Standard Deviation (Sample) | 4.5% | 3.6% |
| Standard Deviation (Population) | 4.5% | 3.5% |
Similar Demographics by Divorced or Separated
Demographics Similar to Norwegians by Divorced or Separated
In terms of divorced or separated, the demographic groups most similar to Norwegians are Immigrants from Thailand (12.1%, a difference of 0.030%), Swedish (12.1%, a difference of 0.050%), Immigrants from Eritrea (12.1%, a difference of 0.050%), Moroccan (12.1%, a difference of 0.060%), and Immigrants from England (12.1%, a difference of 0.070%).
| Demographics | Rating | Rank | Divorced or Separated |
| Immigrants | Nigeria | 40.5 /100 | #185 | Average 12.1% |
| Immigrants | Chile | 39.0 /100 | #186 | Fair 12.1% |
| Belizeans | 37.7 /100 | #187 | Fair 12.1% |
| Immigrants | Belize | 37.6 /100 | #188 | Fair 12.1% |
| Sierra Leoneans | 35.5 /100 | #189 | Fair 12.1% |
| Moroccans | 34.8 /100 | #190 | Fair 12.1% |
| Swedes | 34.4 /100 | #191 | Fair 12.1% |
| Norwegians | 33.2 /100 | #192 | Fair 12.1% |
| Immigrants | Thailand | 32.5 /100 | #193 | Fair 12.1% |
| Immigrants | Eritrea | 31.9 /100 | #194 | Fair 12.1% |
| Immigrants | England | 31.4 /100 | #195 | Fair 12.1% |
| Immigrants | Burma/Myanmar | 30.4 /100 | #196 | Fair 12.1% |
| Immigrants | Africa | 30.3 /100 | #197 | Fair 12.1% |
| Nigerians | 30.1 /100 | #198 | Fair 12.1% |
| Central Americans | 29.4 /100 | #199 | Fair 12.1% |
Demographics Similar to U.S. Virgin Islanders by Divorced or Separated
In terms of divorced or separated, the demographic groups most similar to U.S. Virgin Islanders are Osage (13.4%, a difference of 0.070%), Potawatomi (13.5%, a difference of 0.13%), Immigrants from Congo (13.5%, a difference of 0.14%), Immigrants from Haiti (13.4%, a difference of 0.22%), and Cheyenne (13.4%, a difference of 0.46%).
| Demographics | Rating | Rank | Divorced or Separated |
| Tsimshian | 0.0 /100 | #316 | Tragic 13.3% |
| Haitians | 0.0 /100 | #317 | Tragic 13.3% |
| Cree | 0.0 /100 | #318 | Tragic 13.4% |
| Puget Sound Salish | 0.0 /100 | #319 | Tragic 13.4% |
| Cajuns | 0.0 /100 | #320 | Tragic 13.4% |
| Cheyenne | 0.0 /100 | #321 | Tragic 13.4% |
| Immigrants | Haiti | 0.0 /100 | #322 | Tragic 13.4% |
| U.S. Virgin Islanders | 0.0 /100 | #323 | Tragic 13.4% |
| Osage | 0.0 /100 | #324 | Tragic 13.4% |
| Potawatomi | 0.0 /100 | #325 | Tragic 13.5% |
| Immigrants | Congo | 0.0 /100 | #326 | Tragic 13.5% |
| Comanche | 0.0 /100 | #327 | Tragic 13.5% |
| Immigrants | Caribbean | 0.0 /100 | #328 | Tragic 13.6% |
| Houma | 0.0 /100 | #329 | Tragic 13.6% |
| Paiute | 0.0 /100 | #330 | Tragic 13.6% |