Immigrants from Honduras vs U.S. Virgin Islander Divorced or Separated
COMPARE
Immigrants from Honduras
U.S. Virgin Islander
Divorced or Separated
Divorced or Separated Comparison
Immigrants from Honduras
U.S. Virgin Islanders
12.9%
DIVORCED OR SEPARATED
0.0/ 100
METRIC RATING
291st/ 347
METRIC RANK
13.4%
DIVORCED OR SEPARATED
0.0/ 100
METRIC RATING
323rd/ 347
METRIC RANK
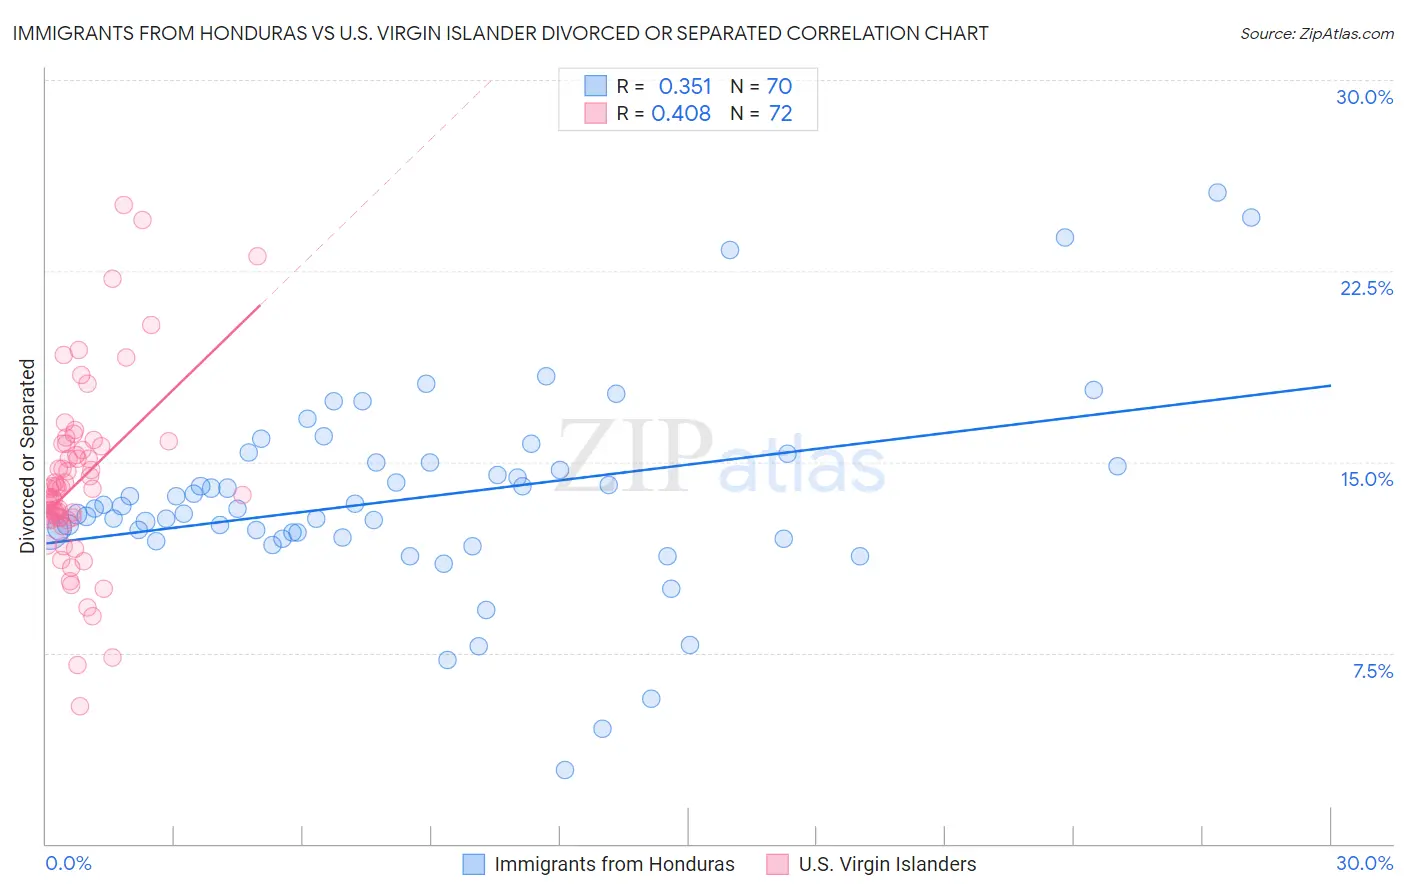
Immigrants from Honduras vs U.S. Virgin Islander Divorced or Separated Correlation Chart
The statistical analysis conducted on geographies consisting of 322,564,867 people shows a mild positive correlation between the proportion of Immigrants from Honduras and percentage of population currently divorced or separated in the United States with a correlation coefficient (R) of 0.351 and weighted average of 12.9%. Similarly, the statistical analysis conducted on geographies consisting of 87,523,386 people shows a moderate positive correlation between the proportion of U.S. Virgin Islanders and percentage of population currently divorced or separated in the United States with a correlation coefficient (R) of 0.408 and weighted average of 13.4%, a difference of 4.2%.
Divorced or Separated Correlation Summary
| Measurement | Immigrants from Honduras | U.S. Virgin Islander |
| Minimum | 2.9% | 5.4% |
| Maximum | 25.6% | 25.1% |
| Range | 22.7% | 19.7% |
| Mean | 13.6% | 14.2% |
| Median | 13.2% | 14.0% |
| Interquartile 25% (IQ1) | 12.0% | 12.8% |
| Interquartile 75% (IQ3) | 15.0% | 15.7% |
| Interquartile Range (IQR) | 2.9% | 2.9% |
| Standard Deviation (Sample) | 3.9% | 3.6% |
| Standard Deviation (Population) | 3.9% | 3.5% |
Similar Demographics by Divorced or Separated
Demographics Similar to Immigrants from Honduras by Divorced or Separated
In terms of divorced or separated, the demographic groups most similar to Immigrants from Honduras are Scotch-Irish (12.9%, a difference of 0.060%), Pima (12.9%, a difference of 0.12%), Iroquois (12.9%, a difference of 0.26%), Jamaican (12.9%, a difference of 0.27%), and Apache (12.9%, a difference of 0.30%).
| Demographics | Rating | Rank | Divorced or Separated |
| Immigrants | Nonimmigrants | 0.1 /100 | #284 | Tragic 12.8% |
| French | 0.1 /100 | #285 | Tragic 12.8% |
| Spanish | 0.1 /100 | #286 | Tragic 12.8% |
| Hondurans | 0.1 /100 | #287 | Tragic 12.8% |
| French Canadians | 0.1 /100 | #288 | Tragic 12.8% |
| Iroquois | 0.0 /100 | #289 | Tragic 12.9% |
| Pima | 0.0 /100 | #290 | Tragic 12.9% |
| Immigrants | Honduras | 0.0 /100 | #291 | Tragic 12.9% |
| Scotch-Irish | 0.0 /100 | #292 | Tragic 12.9% |
| Jamaicans | 0.0 /100 | #293 | Tragic 12.9% |
| Apache | 0.0 /100 | #294 | Tragic 12.9% |
| Celtics | 0.0 /100 | #295 | Tragic 13.0% |
| Nicaraguans | 0.0 /100 | #296 | Tragic 13.0% |
| Natives/Alaskans | 0.0 /100 | #297 | Tragic 13.0% |
| Venezuelans | 0.0 /100 | #298 | Tragic 13.0% |
Demographics Similar to U.S. Virgin Islanders by Divorced or Separated
In terms of divorced or separated, the demographic groups most similar to U.S. Virgin Islanders are Osage (13.4%, a difference of 0.070%), Potawatomi (13.5%, a difference of 0.13%), Immigrants from Congo (13.5%, a difference of 0.14%), Immigrants from Haiti (13.4%, a difference of 0.22%), and Cheyenne (13.4%, a difference of 0.46%).
| Demographics | Rating | Rank | Divorced or Separated |
| Tsimshian | 0.0 /100 | #316 | Tragic 13.3% |
| Haitians | 0.0 /100 | #317 | Tragic 13.3% |
| Cree | 0.0 /100 | #318 | Tragic 13.4% |
| Puget Sound Salish | 0.0 /100 | #319 | Tragic 13.4% |
| Cajuns | 0.0 /100 | #320 | Tragic 13.4% |
| Cheyenne | 0.0 /100 | #321 | Tragic 13.4% |
| Immigrants | Haiti | 0.0 /100 | #322 | Tragic 13.4% |
| U.S. Virgin Islanders | 0.0 /100 | #323 | Tragic 13.4% |
| Osage | 0.0 /100 | #324 | Tragic 13.4% |
| Potawatomi | 0.0 /100 | #325 | Tragic 13.5% |
| Immigrants | Congo | 0.0 /100 | #326 | Tragic 13.5% |
| Comanche | 0.0 /100 | #327 | Tragic 13.5% |
| Immigrants | Caribbean | 0.0 /100 | #328 | Tragic 13.6% |
| Houma | 0.0 /100 | #329 | Tragic 13.6% |
| Paiute | 0.0 /100 | #330 | Tragic 13.6% |