Scandinavian vs U.S. Virgin Islander Divorced or Separated
COMPARE
Scandinavian
U.S. Virgin Islander
Divorced or Separated
Divorced or Separated Comparison
Scandinavians
U.S. Virgin Islanders
12.3%
DIVORCED OR SEPARATED
10.4/ 100
METRIC RATING
223rd/ 347
METRIC RANK
13.4%
DIVORCED OR SEPARATED
0.0/ 100
METRIC RATING
323rd/ 347
METRIC RANK
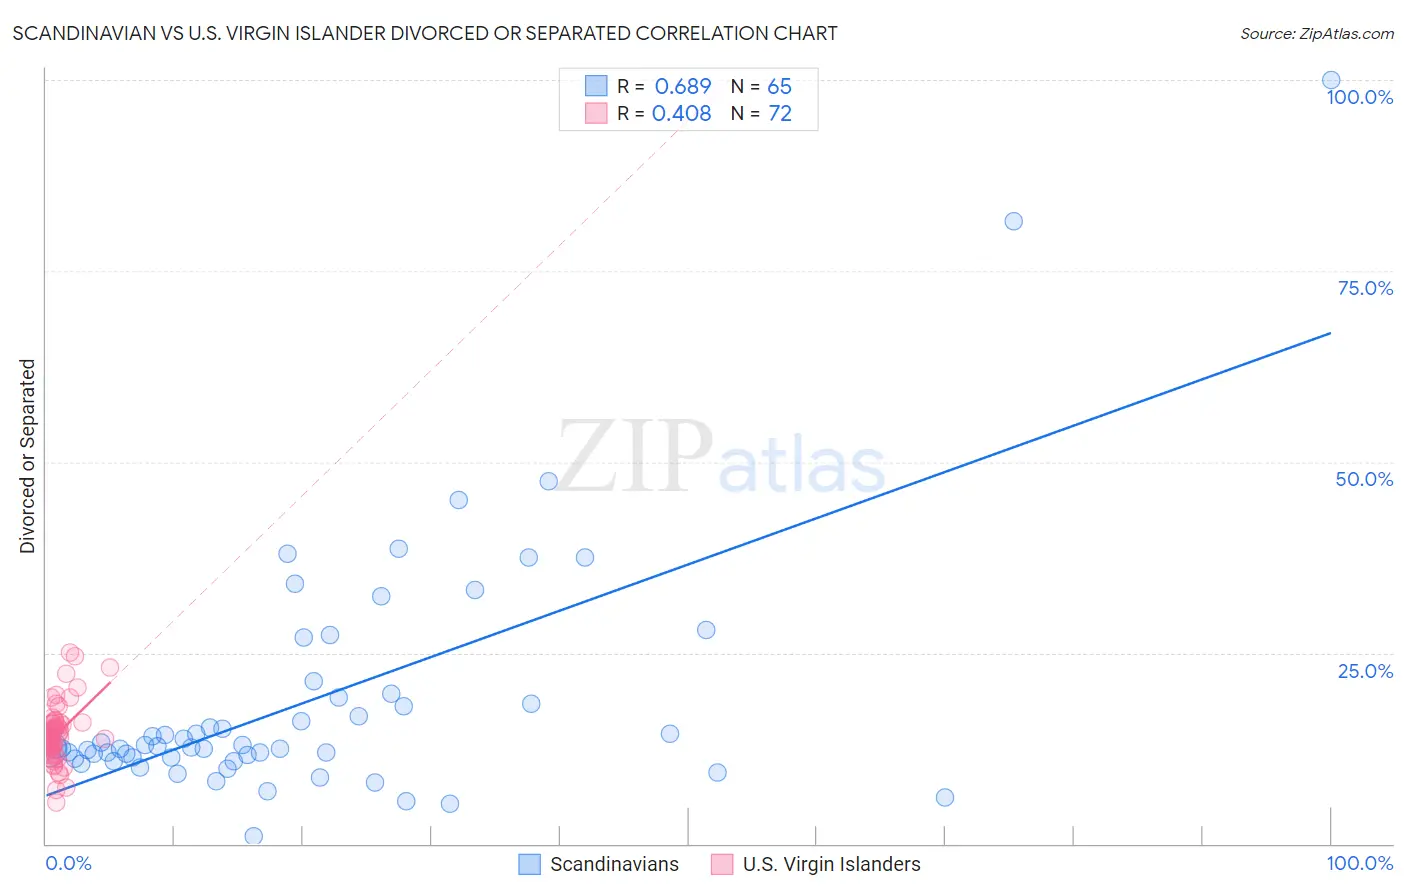
Scandinavian vs U.S. Virgin Islander Divorced or Separated Correlation Chart
The statistical analysis conducted on geographies consisting of 472,421,001 people shows a significant positive correlation between the proportion of Scandinavians and percentage of population currently divorced or separated in the United States with a correlation coefficient (R) of 0.689 and weighted average of 12.3%. Similarly, the statistical analysis conducted on geographies consisting of 87,523,386 people shows a moderate positive correlation between the proportion of U.S. Virgin Islanders and percentage of population currently divorced or separated in the United States with a correlation coefficient (R) of 0.408 and weighted average of 13.4%, a difference of 9.4%.
Divorced or Separated Correlation Summary
| Measurement | Scandinavian | U.S. Virgin Islander |
| Minimum | 1.0% | 5.4% |
| Maximum | 100.0% | 25.1% |
| Range | 99.0% | 19.7% |
| Mean | 18.9% | 14.2% |
| Median | 12.6% | 14.0% |
| Interquartile 25% (IQ1) | 11.2% | 12.8% |
| Interquartile 75% (IQ3) | 19.4% | 15.7% |
| Interquartile Range (IQR) | 8.2% | 2.9% |
| Standard Deviation (Sample) | 16.4% | 3.6% |
| Standard Deviation (Population) | 16.3% | 3.5% |
Similar Demographics by Divorced or Separated
Demographics Similar to Scandinavians by Divorced or Separated
In terms of divorced or separated, the demographic groups most similar to Scandinavians are Bangladeshi (12.3%, a difference of 0.010%), Immigrants from the Azores (12.3%, a difference of 0.070%), Belgian (12.3%, a difference of 0.070%), Guamanian/Chamorro (12.3%, a difference of 0.080%), and Immigrants from Western Africa (12.3%, a difference of 0.10%).
| Demographics | Rating | Rank | Divorced or Separated |
| Immigrants | South America | 15.4 /100 | #216 | Poor 12.2% |
| Northern Europeans | 14.7 /100 | #217 | Poor 12.2% |
| Slovenes | 13.2 /100 | #218 | Poor 12.3% |
| Czechoslovakians | 11.7 /100 | #219 | Poor 12.3% |
| British | 11.6 /100 | #220 | Poor 12.3% |
| Guamanians/Chamorros | 11.3 /100 | #221 | Poor 12.3% |
| Bangladeshis | 10.5 /100 | #222 | Poor 12.3% |
| Scandinavians | 10.4 /100 | #223 | Poor 12.3% |
| Immigrants | Azores | 9.7 /100 | #224 | Tragic 12.3% |
| Belgians | 9.7 /100 | #225 | Tragic 12.3% |
| Immigrants | Western Africa | 9.3 /100 | #226 | Tragic 12.3% |
| Hmong | 8.8 /100 | #227 | Tragic 12.3% |
| Immigrants | Cameroon | 8.3 /100 | #228 | Tragic 12.3% |
| Immigrants | Sudan | 8.2 /100 | #229 | Tragic 12.3% |
| Yakama | 7.8 /100 | #230 | Tragic 12.3% |
Demographics Similar to U.S. Virgin Islanders by Divorced or Separated
In terms of divorced or separated, the demographic groups most similar to U.S. Virgin Islanders are Osage (13.4%, a difference of 0.070%), Potawatomi (13.5%, a difference of 0.13%), Immigrants from Congo (13.5%, a difference of 0.14%), Immigrants from Haiti (13.4%, a difference of 0.22%), and Cheyenne (13.4%, a difference of 0.46%).
| Demographics | Rating | Rank | Divorced or Separated |
| Tsimshian | 0.0 /100 | #316 | Tragic 13.3% |
| Haitians | 0.0 /100 | #317 | Tragic 13.3% |
| Cree | 0.0 /100 | #318 | Tragic 13.4% |
| Puget Sound Salish | 0.0 /100 | #319 | Tragic 13.4% |
| Cajuns | 0.0 /100 | #320 | Tragic 13.4% |
| Cheyenne | 0.0 /100 | #321 | Tragic 13.4% |
| Immigrants | Haiti | 0.0 /100 | #322 | Tragic 13.4% |
| U.S. Virgin Islanders | 0.0 /100 | #323 | Tragic 13.4% |
| Osage | 0.0 /100 | #324 | Tragic 13.4% |
| Potawatomi | 0.0 /100 | #325 | Tragic 13.5% |
| Immigrants | Congo | 0.0 /100 | #326 | Tragic 13.5% |
| Comanche | 0.0 /100 | #327 | Tragic 13.5% |
| Immigrants | Caribbean | 0.0 /100 | #328 | Tragic 13.6% |
| Houma | 0.0 /100 | #329 | Tragic 13.6% |
| Paiute | 0.0 /100 | #330 | Tragic 13.6% |