Asian vs Shoshone Single Father Households
COMPARE
Asian
Shoshone
Single Father Households
Single Father Households Comparison
Asians
Shoshone
2.1%
SINGLE FATHER HOUSEHOLDS
99.6/ 100
METRIC RATING
86th/ 347
METRIC RANK
2.6%
SINGLE FATHER HOUSEHOLDS
0.1/ 100
METRIC RATING
277th/ 347
METRIC RANK
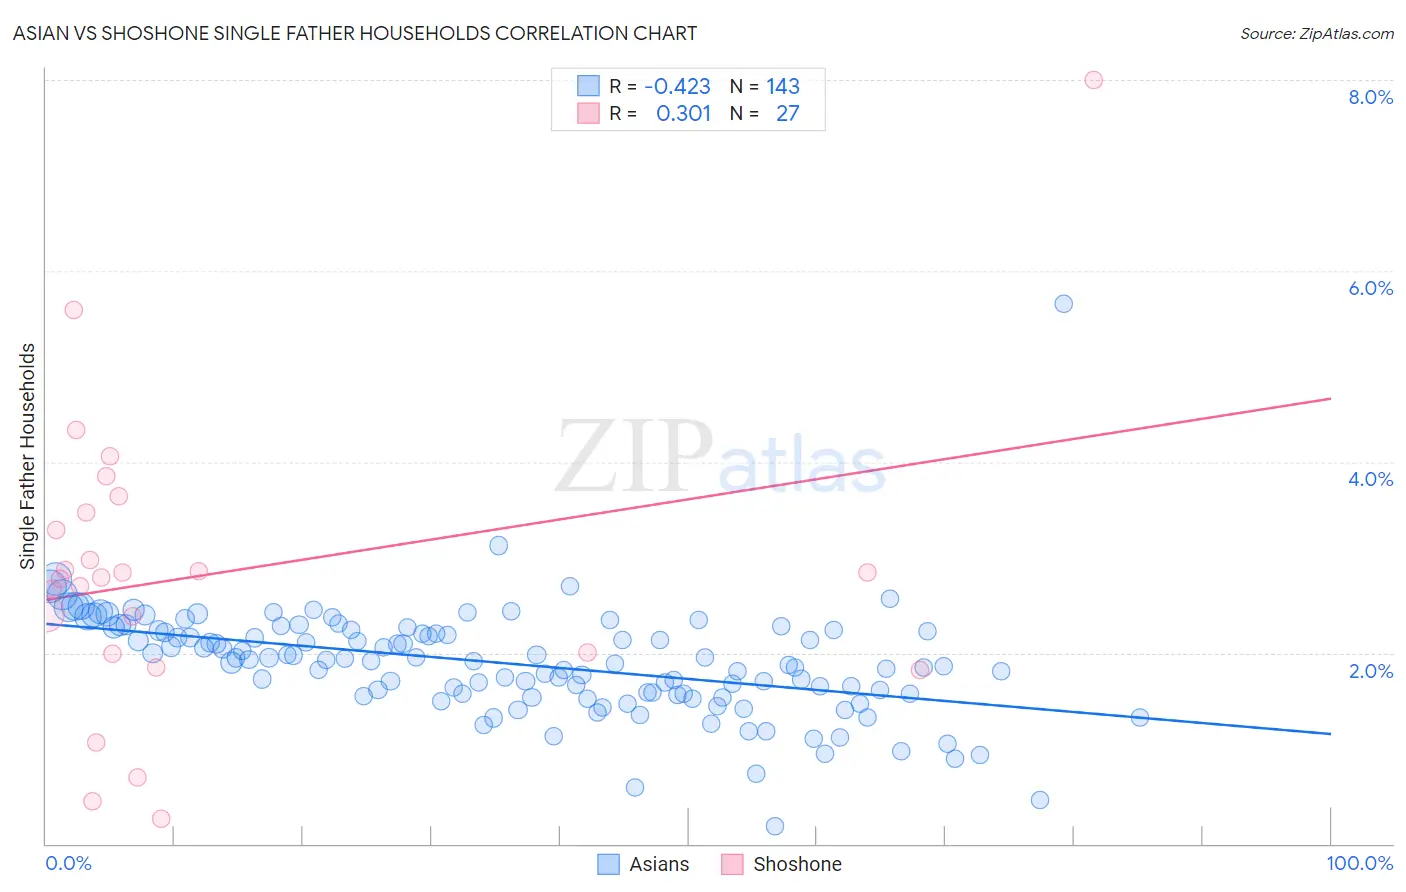
Asian vs Shoshone Single Father Households Correlation Chart
The statistical analysis conducted on geographies consisting of 539,811,945 people shows a moderate negative correlation between the proportion of Asians and percentage of single father households in the United States with a correlation coefficient (R) of -0.423 and weighted average of 2.1%. Similarly, the statistical analysis conducted on geographies consisting of 66,467,409 people shows a mild positive correlation between the proportion of Shoshone and percentage of single father households in the United States with a correlation coefficient (R) of 0.301 and weighted average of 2.6%, a difference of 24.8%.
Single Father Households Correlation Summary
| Measurement | Asian | Shoshone |
| Minimum | 0.19% | 0.27% |
| Maximum | 5.7% | 8.0% |
| Range | 5.5% | 7.7% |
| Mean | 1.9% | 2.8% |
| Median | 1.9% | 2.8% |
| Interquartile 25% (IQ1) | 1.6% | 2.0% |
| Interquartile 75% (IQ3) | 2.2% | 3.5% |
| Interquartile Range (IQR) | 0.67% | 1.5% |
| Standard Deviation (Sample) | 0.58% | 1.6% |
| Standard Deviation (Population) | 0.58% | 1.5% |
Similar Demographics by Single Father Households
Demographics Similar to Asians by Single Father Households
In terms of single father households, the demographic groups most similar to Asians are Immigrants from Hungary (2.1%, a difference of 0.080%), Carpatho Rusyn (2.1%, a difference of 0.12%), Greek (2.1%, a difference of 0.42%), New Zealander (2.1%, a difference of 0.43%), and Armenian (2.1%, a difference of 0.48%).
| Demographics | Rating | Rank | Single Father Households |
| Immigrants | Asia | 99.7 /100 | #79 | Exceptional 2.1% |
| Immigrants | South Africa | 99.7 /100 | #80 | Exceptional 2.1% |
| Armenians | 99.7 /100 | #81 | Exceptional 2.1% |
| New Zealanders | 99.7 /100 | #82 | Exceptional 2.1% |
| Greeks | 99.7 /100 | #83 | Exceptional 2.1% |
| Carpatho Rusyns | 99.6 /100 | #84 | Exceptional 2.1% |
| Immigrants | Hungary | 99.6 /100 | #85 | Exceptional 2.1% |
| Asians | 99.6 /100 | #86 | Exceptional 2.1% |
| Lithuanians | 99.5 /100 | #87 | Exceptional 2.1% |
| Bhutanese | 99.5 /100 | #88 | Exceptional 2.1% |
| Immigrants | Armenia | 99.5 /100 | #89 | Exceptional 2.1% |
| Immigrants | Pakistan | 99.5 /100 | #90 | Exceptional 2.1% |
| Immigrants | Guyana | 99.4 /100 | #91 | Exceptional 2.1% |
| Romanians | 99.4 /100 | #92 | Exceptional 2.1% |
| Croatians | 99.3 /100 | #93 | Exceptional 2.1% |
Demographics Similar to Shoshone by Single Father Households
In terms of single father households, the demographic groups most similar to Shoshone are Immigrants from Haiti (2.6%, a difference of 0.030%), Cherokee (2.6%, a difference of 0.050%), Samoan (2.6%, a difference of 0.090%), Immigrants from Dominican Republic (2.6%, a difference of 0.24%), and Immigrants from Portugal (2.6%, a difference of 0.64%).
| Demographics | Rating | Rank | Single Father Households |
| Seminole | 0.3 /100 | #270 | Tragic 2.6% |
| Creek | 0.2 /100 | #271 | Tragic 2.6% |
| Belizeans | 0.2 /100 | #272 | Tragic 2.6% |
| Iroquois | 0.2 /100 | #273 | Tragic 2.6% |
| Puerto Ricans | 0.2 /100 | #274 | Tragic 2.6% |
| Immigrants | Dominican Republic | 0.2 /100 | #275 | Tragic 2.6% |
| Immigrants | Haiti | 0.1 /100 | #276 | Tragic 2.6% |
| Shoshone | 0.1 /100 | #277 | Tragic 2.6% |
| Cherokee | 0.1 /100 | #278 | Tragic 2.6% |
| Samoans | 0.1 /100 | #279 | Tragic 2.6% |
| Immigrants | Portugal | 0.1 /100 | #280 | Tragic 2.6% |
| Nicaraguans | 0.1 /100 | #281 | Tragic 2.6% |
| Dutch West Indians | 0.1 /100 | #282 | Tragic 2.6% |
| Immigrants | Nicaragua | 0.1 /100 | #283 | Tragic 2.7% |
| Hawaiians | 0.1 /100 | #284 | Tragic 2.7% |