Thai vs Shoshone Single Father Households
COMPARE
Thai
Shoshone
Single Father Households
Single Father Households Comparison
Thais
Shoshone
1.9%
SINGLE FATHER HOUSEHOLDS
100.0/ 100
METRIC RATING
20th/ 347
METRIC RANK
2.6%
SINGLE FATHER HOUSEHOLDS
0.1/ 100
METRIC RATING
277th/ 347
METRIC RANK
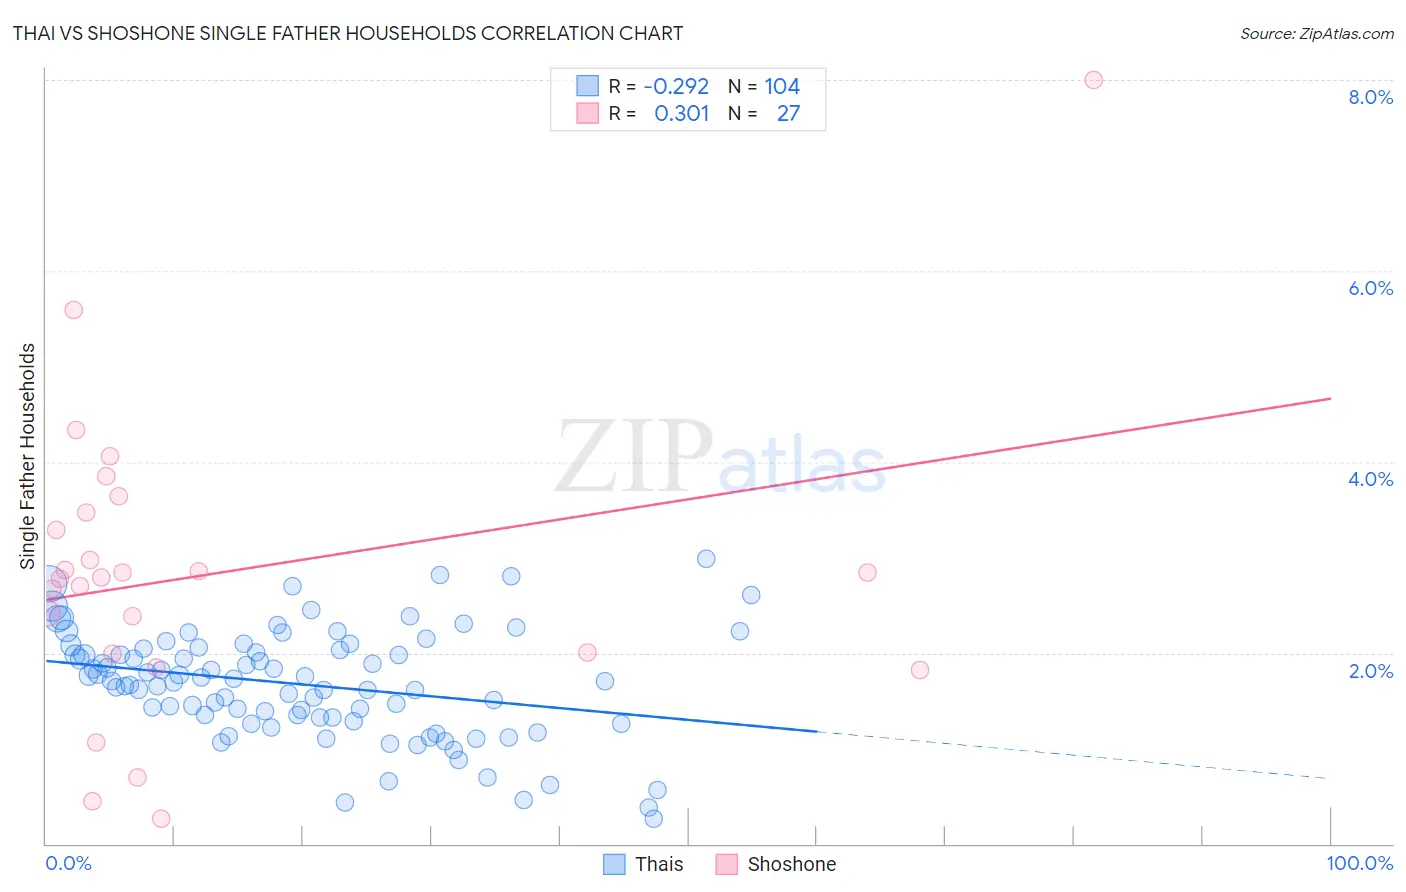
Thai vs Shoshone Single Father Households Correlation Chart
The statistical analysis conducted on geographies consisting of 470,214,576 people shows a weak negative correlation between the proportion of Thais and percentage of single father households in the United States with a correlation coefficient (R) of -0.292 and weighted average of 1.9%. Similarly, the statistical analysis conducted on geographies consisting of 66,467,409 people shows a mild positive correlation between the proportion of Shoshone and percentage of single father households in the United States with a correlation coefficient (R) of 0.301 and weighted average of 2.6%, a difference of 36.3%.
Single Father Households Correlation Summary
| Measurement | Thai | Shoshone |
| Minimum | 0.26% | 0.27% |
| Maximum | 3.0% | 8.0% |
| Range | 2.7% | 7.7% |
| Mean | 1.7% | 2.8% |
| Median | 1.7% | 2.8% |
| Interquartile 25% (IQ1) | 1.3% | 2.0% |
| Interquartile 75% (IQ3) | 2.0% | 3.5% |
| Interquartile Range (IQR) | 0.72% | 1.5% |
| Standard Deviation (Sample) | 0.56% | 1.6% |
| Standard Deviation (Population) | 0.56% | 1.5% |
Similar Demographics by Single Father Households
Demographics Similar to Thais by Single Father Households
In terms of single father households, the demographic groups most similar to Thais are Iranian (1.9%, a difference of 0.070%), Immigrants from Albania (1.9%, a difference of 0.30%), Immigrants from Latvia (1.9%, a difference of 0.49%), Indian (Asian) (1.9%, a difference of 0.91%), and Immigrants from India (1.9%, a difference of 1.4%).
| Demographics | Rating | Rank | Single Father Households |
| Immigrants | Singapore | 100.0 /100 | #13 | Exceptional 1.9% |
| Immigrants | Lithuania | 100.0 /100 | #14 | Exceptional 1.9% |
| Immigrants | Eastern Asia | 100.0 /100 | #15 | Exceptional 1.9% |
| Immigrants | Iran | 100.0 /100 | #16 | Exceptional 1.9% |
| Immigrants | India | 100.0 /100 | #17 | Exceptional 1.9% |
| Indians (Asian) | 100.0 /100 | #18 | Exceptional 1.9% |
| Iranians | 100.0 /100 | #19 | Exceptional 1.9% |
| Thais | 100.0 /100 | #20 | Exceptional 1.9% |
| Immigrants | Albania | 100.0 /100 | #21 | Exceptional 1.9% |
| Immigrants | Latvia | 100.0 /100 | #22 | Exceptional 1.9% |
| Immigrants | Croatia | 100.0 /100 | #23 | Exceptional 2.0% |
| Immigrants | Russia | 100.0 /100 | #24 | Exceptional 2.0% |
| Eastern Europeans | 100.0 /100 | #25 | Exceptional 2.0% |
| Assyrians/Chaldeans/Syriacs | 100.0 /100 | #26 | Exceptional 2.0% |
| Immigrants | South Central Asia | 100.0 /100 | #27 | Exceptional 2.0% |
Demographics Similar to Shoshone by Single Father Households
In terms of single father households, the demographic groups most similar to Shoshone are Immigrants from Haiti (2.6%, a difference of 0.030%), Cherokee (2.6%, a difference of 0.050%), Samoan (2.6%, a difference of 0.090%), Immigrants from Dominican Republic (2.6%, a difference of 0.24%), and Immigrants from Portugal (2.6%, a difference of 0.64%).
| Demographics | Rating | Rank | Single Father Households |
| Seminole | 0.3 /100 | #270 | Tragic 2.6% |
| Creek | 0.2 /100 | #271 | Tragic 2.6% |
| Belizeans | 0.2 /100 | #272 | Tragic 2.6% |
| Iroquois | 0.2 /100 | #273 | Tragic 2.6% |
| Puerto Ricans | 0.2 /100 | #274 | Tragic 2.6% |
| Immigrants | Dominican Republic | 0.2 /100 | #275 | Tragic 2.6% |
| Immigrants | Haiti | 0.1 /100 | #276 | Tragic 2.6% |
| Shoshone | 0.1 /100 | #277 | Tragic 2.6% |
| Cherokee | 0.1 /100 | #278 | Tragic 2.6% |
| Samoans | 0.1 /100 | #279 | Tragic 2.6% |
| Immigrants | Portugal | 0.1 /100 | #280 | Tragic 2.6% |
| Nicaraguans | 0.1 /100 | #281 | Tragic 2.6% |
| Dutch West Indians | 0.1 /100 | #282 | Tragic 2.6% |
| Immigrants | Nicaragua | 0.1 /100 | #283 | Tragic 2.7% |
| Hawaiians | 0.1 /100 | #284 | Tragic 2.7% |