Pennsylvania German vs Jamaican Average Family Size
COMPARE
Pennsylvania German
Jamaican
Average Family Size
Average Family Size Comparison
Pennsylvania Germans
Jamaicans
3.19
AVERAGE FAMILY SIZE
9.3/ 100
METRIC RATING
219th/ 347
METRIC RANK
3.31
AVERAGE FAMILY SIZE
99.7/ 100
METRIC RATING
86th/ 347
METRIC RANK
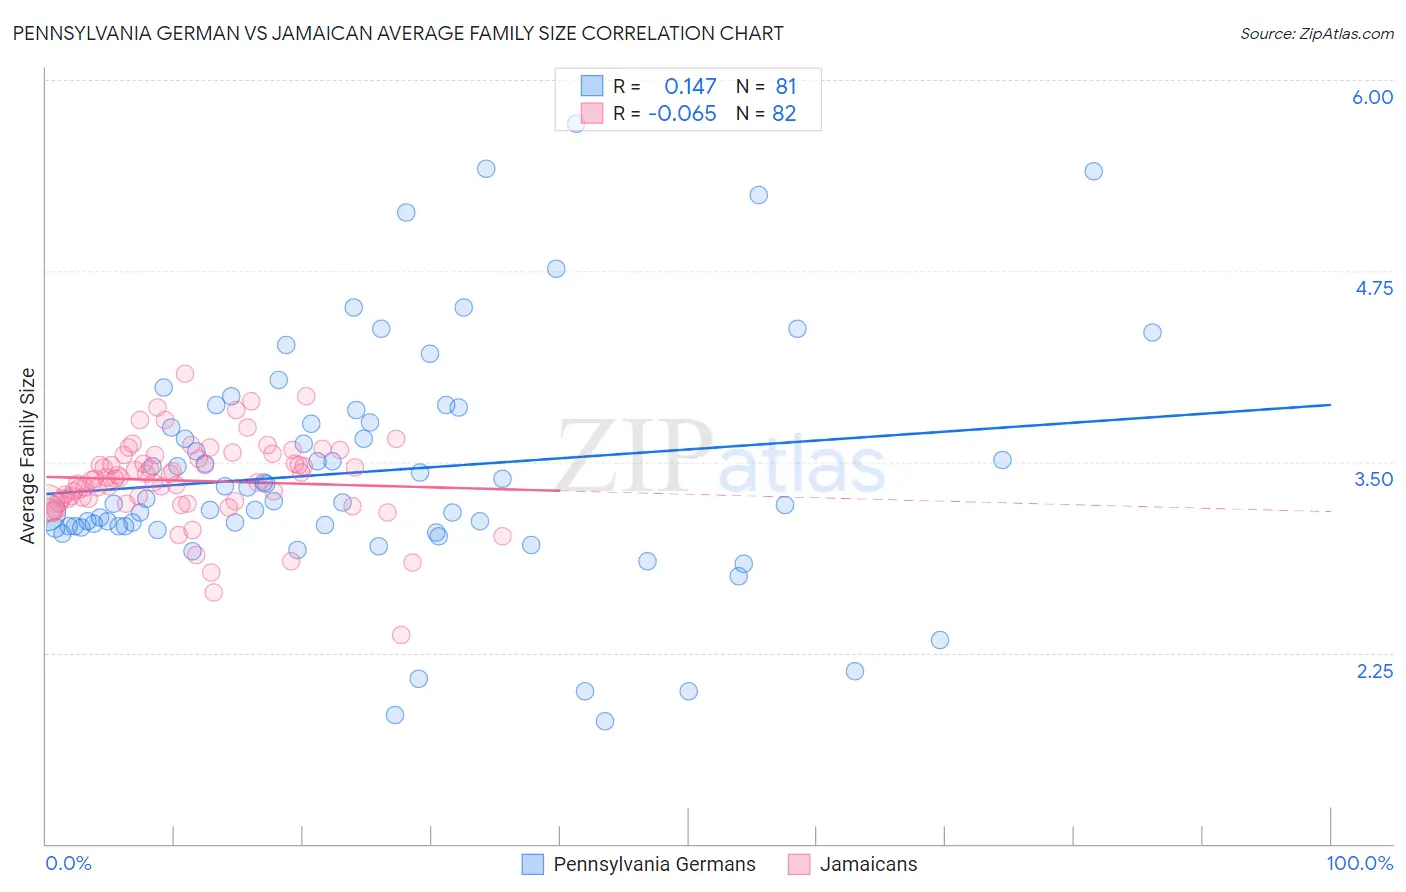
Pennsylvania German vs Jamaican Average Family Size Correlation Chart
The statistical analysis conducted on geographies consisting of 234,061,809 people shows a poor positive correlation between the proportion of Pennsylvania Germans and average family size in the United States with a correlation coefficient (R) of 0.147 and weighted average of 3.19. Similarly, the statistical analysis conducted on geographies consisting of 367,646,796 people shows a slight negative correlation between the proportion of Jamaicans and average family size in the United States with a correlation coefficient (R) of -0.065 and weighted average of 3.31, a difference of 3.7%.
Average Family Size Correlation Summary
| Measurement | Pennsylvania German | Jamaican |
| Minimum | 1.80 | 2.36 |
| Maximum | 5.71 | 4.08 |
| Range | 3.91 | 1.72 |
| Mean | 3.44 | 3.38 |
| Median | 3.24 | 3.39 |
| Interquartile 25% (IQ1) | 3.07 | 3.24 |
| Interquartile 75% (IQ3) | 3.80 | 3.54 |
| Interquartile Range (IQR) | 0.73 | 0.30 |
| Standard Deviation (Sample) | 0.78 | 0.28 |
| Standard Deviation (Population) | 0.77 | 0.28 |
Similar Demographics by Average Family Size
Demographics Similar to Pennsylvania Germans by Average Family Size
In terms of average family size, the demographic groups most similar to Pennsylvania Germans are Lebanese (3.19, a difference of 0.010%), French American Indian (3.20, a difference of 0.030%), Immigrants from Somalia (3.20, a difference of 0.050%), Delaware (3.20, a difference of 0.090%), and Bermudan (3.20, a difference of 0.090%).
| Demographics | Rating | Rank | Average Family Size |
| Creek | 12.1 /100 | #212 | Poor 3.20 |
| Mongolians | 11.5 /100 | #213 | Poor 3.20 |
| Somalis | 11.2 /100 | #214 | Poor 3.20 |
| Delaware | 11.1 /100 | #215 | Poor 3.20 |
| Bermudans | 11.0 /100 | #216 | Poor 3.20 |
| Immigrants | Somalia | 10.3 /100 | #217 | Poor 3.20 |
| French American Indians | 9.8 /100 | #218 | Tragic 3.20 |
| Pennsylvania Germans | 9.3 /100 | #219 | Tragic 3.19 |
| Lebanese | 9.1 /100 | #220 | Tragic 3.19 |
| Immigrants | Ukraine | 7.2 /100 | #221 | Tragic 3.19 |
| Immigrants | Kuwait | 7.2 /100 | #222 | Tragic 3.19 |
| Immigrants | Zimbabwe | 7.1 /100 | #223 | Tragic 3.19 |
| Syrians | 6.5 /100 | #224 | Tragic 3.19 |
| Cree | 6.2 /100 | #225 | Tragic 3.19 |
| Chickasaw | 6.0 /100 | #226 | Tragic 3.19 |
Demographics Similar to Jamaicans by Average Family Size
In terms of average family size, the demographic groups most similar to Jamaicans are Afghan (3.31, a difference of 0.020%), Immigrants from Peru (3.31, a difference of 0.050%), Immigrants from Nigeria (3.32, a difference of 0.060%), Immigrants from Afghanistan (3.32, a difference of 0.10%), and Ecuadorian (3.32, a difference of 0.11%).
| Demographics | Rating | Rank | Average Family Size |
| British West Indians | 99.8 /100 | #79 | Exceptional 3.32 |
| Lumbee | 99.8 /100 | #80 | Exceptional 3.32 |
| Immigrants | Dominica | 99.8 /100 | #81 | Exceptional 3.32 |
| Ecuadorians | 99.8 /100 | #82 | Exceptional 3.32 |
| Immigrants | Afghanistan | 99.8 /100 | #83 | Exceptional 3.32 |
| Immigrants | Nigeria | 99.7 /100 | #84 | Exceptional 3.32 |
| Afghans | 99.7 /100 | #85 | Exceptional 3.31 |
| Jamaicans | 99.7 /100 | #86 | Exceptional 3.31 |
| Immigrants | Peru | 99.7 /100 | #87 | Exceptional 3.31 |
| Immigrants | Bolivia | 99.6 /100 | #88 | Exceptional 3.31 |
| Malaysians | 99.6 /100 | #89 | Exceptional 3.31 |
| Menominee | 99.4 /100 | #90 | Exceptional 3.30 |
| Immigrants | Pakistan | 99.2 /100 | #91 | Exceptional 3.30 |
| Immigrants | Cameroon | 99.2 /100 | #92 | Exceptional 3.30 |
| Peruvians | 99.2 /100 | #93 | Exceptional 3.30 |