Immigrants from South Central Asia vs Inupiat Family Households with Children
COMPARE
Immigrants from South Central Asia
Inupiat
Family Households with Children
Family Households with Children Comparison
Immigrants from South Central Asia
Inupiat
30.0%
FAMILY HOUSEHOLDS WITH CHILDREN
100.0/ 100
METRIC RATING
15th/ 347
METRIC RANK
32.8%
FAMILY HOUSEHOLDS WITH CHILDREN
100/ 100
METRIC RATING
2nd/ 347
METRIC RANK
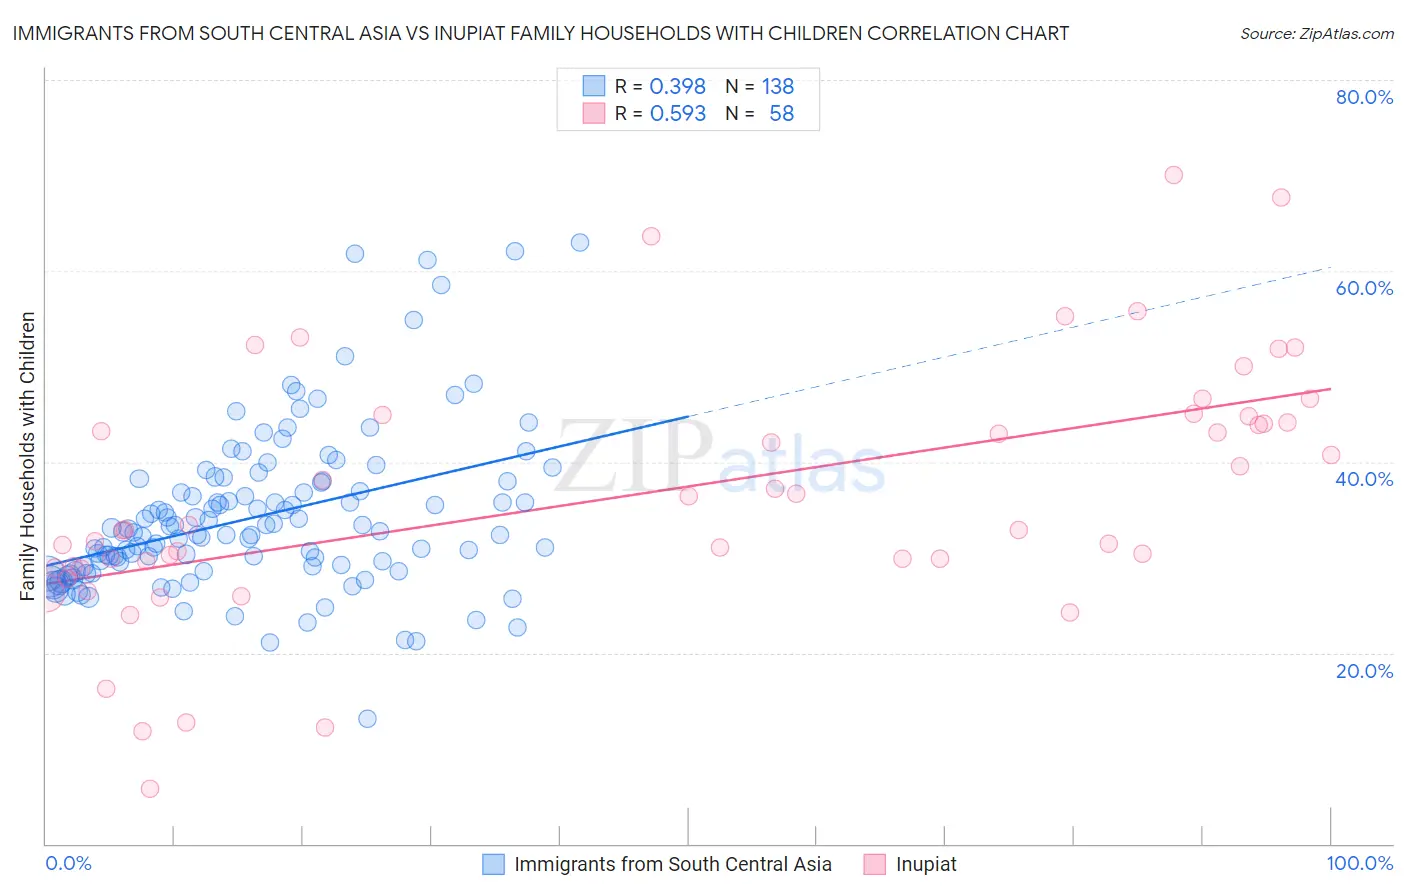
Immigrants from South Central Asia vs Inupiat Family Households with Children Correlation Chart
The statistical analysis conducted on geographies consisting of 472,487,165 people shows a mild positive correlation between the proportion of Immigrants from South Central Asia and percentage of family households with children in the United States with a correlation coefficient (R) of 0.398 and weighted average of 30.0%. Similarly, the statistical analysis conducted on geographies consisting of 96,318,609 people shows a substantial positive correlation between the proportion of Inupiat and percentage of family households with children in the United States with a correlation coefficient (R) of 0.593 and weighted average of 32.8%, a difference of 9.3%.
Family Households with Children Correlation Summary
| Measurement | Immigrants from South Central Asia | Inupiat |
| Minimum | 13.1% | 5.8% |
| Maximum | 63.0% | 70.0% |
| Range | 49.9% | 64.2% |
| Mean | 34.2% | 36.6% |
| Median | 32.7% | 33.1% |
| Interquartile 25% (IQ1) | 29.0% | 29.1% |
| Interquartile 75% (IQ3) | 37.9% | 44.8% |
| Interquartile Range (IQR) | 8.9% | 15.7% |
| Standard Deviation (Sample) | 8.4% | 13.3% |
| Standard Deviation (Population) | 8.4% | 13.2% |
Demographics Similar to Immigrants from South Central Asia and Inupiat by Family Households with Children
In terms of family households with children, the demographic groups most similar to Immigrants from South Central Asia are Immigrants from Afghanistan (30.0%, a difference of 0.020%), Bangladeshi (30.1%, a difference of 0.17%), Hispanic or Latino (29.9%, a difference of 0.41%), Afghan (30.2%, a difference of 0.46%), and Salvadoran (29.9%, a difference of 0.60%). Similarly, the demographic groups most similar to Inupiat are Immigrants from Mexico (31.6%, a difference of 3.9%), Mexican (31.4%, a difference of 4.7%), Tongan (31.2%, a difference of 5.1%), Immigrants from India (31.0%, a difference of 5.8%), and Immigrants from Central America (31.0%, a difference of 6.1%).
| Demographics | Rating | Rank | Family Households with Children |
| Yup'ik | 100 /100 | #1 | Exceptional 37.0% |
| Inupiat | 100 /100 | #2 | Exceptional 32.8% |
| Immigrants | Mexico | 100.0 /100 | #3 | Exceptional 31.6% |
| Mexicans | 100.0 /100 | #4 | Exceptional 31.4% |
| Tongans | 100.0 /100 | #5 | Exceptional 31.2% |
| Immigrants | India | 100.0 /100 | #6 | Exceptional 31.0% |
| Immigrants | Central America | 100.0 /100 | #7 | Exceptional 31.0% |
| Yakama | 100.0 /100 | #8 | Exceptional 30.8% |
| Thais | 100.0 /100 | #9 | Exceptional 30.6% |
| Immigrants | Fiji | 100.0 /100 | #10 | Exceptional 30.5% |
| Nepalese | 100.0 /100 | #11 | Exceptional 30.5% |
| Immigrants | Pakistan | 100.0 /100 | #12 | Exceptional 30.2% |
| Afghans | 100.0 /100 | #13 | Exceptional 30.2% |
| Bangladeshis | 100.0 /100 | #14 | Exceptional 30.1% |
| Immigrants | South Central Asia | 100.0 /100 | #15 | Exceptional 30.0% |
| Immigrants | Afghanistan | 100.0 /100 | #16 | Exceptional 30.0% |
| Hispanics or Latinos | 100.0 /100 | #17 | Exceptional 29.9% |
| Salvadorans | 100.0 /100 | #18 | Exceptional 29.9% |
| Alaska Natives | 100.0 /100 | #19 | Exceptional 29.9% |
| Immigrants | El Salvador | 100.0 /100 | #20 | Exceptional 29.8% |