White/Caucasian vs Immigrants from Micronesia 6th Grade
COMPARE
White/Caucasian
Immigrants from Micronesia
6th Grade
6th Grade Comparison
Whites/Caucasians
Immigrants from Micronesia
97.7%
6TH GRADE
99.8/ 100
METRIC RATING
57th/ 347
METRIC RANK
97.0%
6TH GRADE
47.1/ 100
METRIC RATING
176th/ 347
METRIC RANK
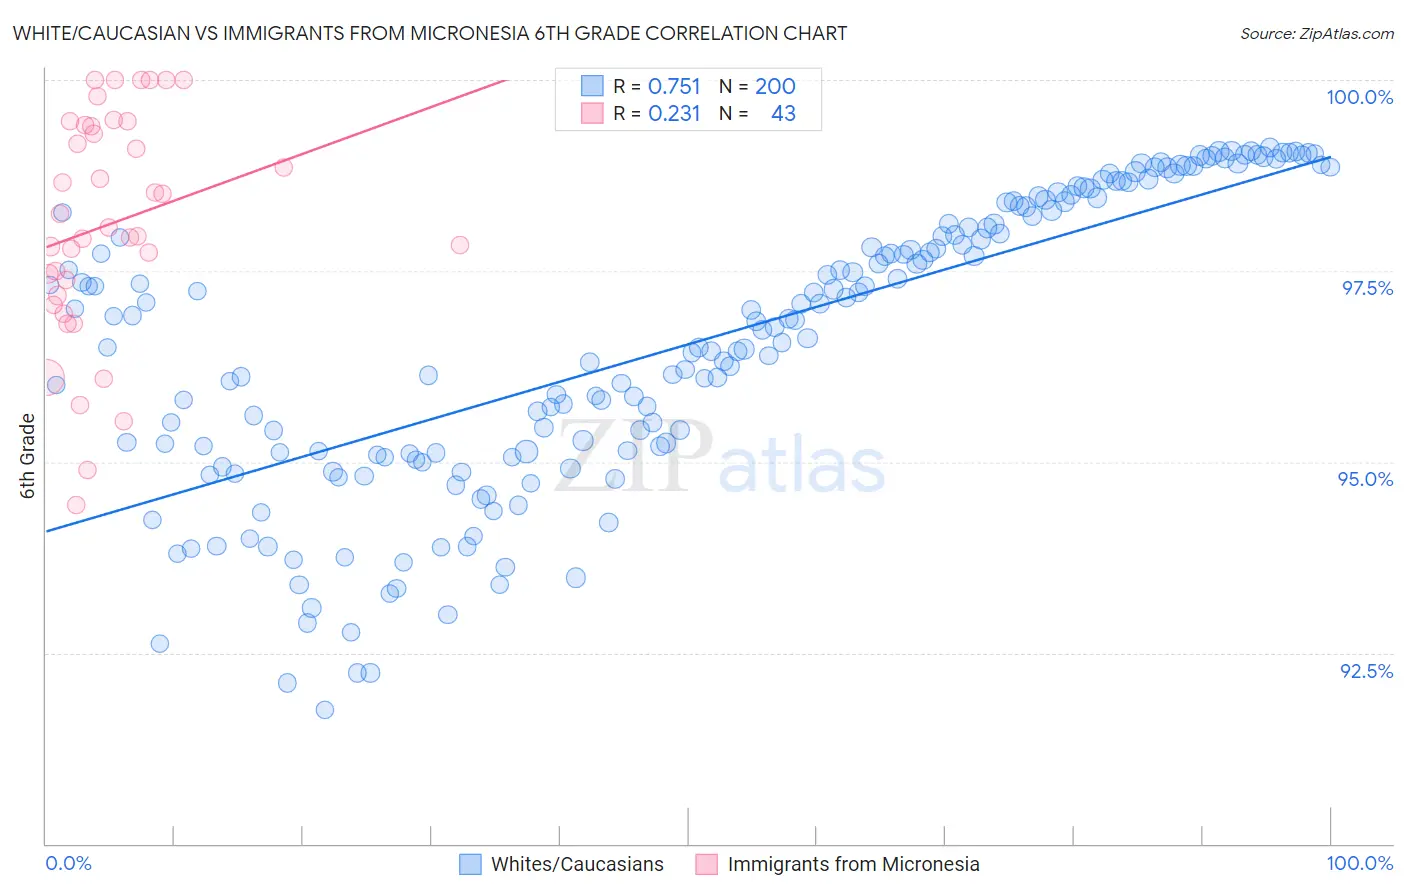
White/Caucasian vs Immigrants from Micronesia 6th Grade Correlation Chart
The statistical analysis conducted on geographies consisting of 585,247,205 people shows a strong positive correlation between the proportion of Whites/Caucasians and percentage of population with at least 6th grade education in the United States with a correlation coefficient (R) of 0.751 and weighted average of 97.7%. Similarly, the statistical analysis conducted on geographies consisting of 61,604,657 people shows a weak positive correlation between the proportion of Immigrants from Micronesia and percentage of population with at least 6th grade education in the United States with a correlation coefficient (R) of 0.231 and weighted average of 97.0%, a difference of 0.72%.
6th Grade Correlation Summary
| Measurement | White/Caucasian | Immigrants from Micronesia |
| Minimum | 91.7% | 94.4% |
| Maximum | 99.1% | 100.0% |
| Range | 7.4% | 5.6% |
| Mean | 96.5% | 98.1% |
| Median | 96.8% | 98.1% |
| Interquartile 25% (IQ1) | 95.1% | 97.2% |
| Interquartile 75% (IQ3) | 98.3% | 99.4% |
| Interquartile Range (IQR) | 3.2% | 2.2% |
| Standard Deviation (Sample) | 1.9% | 1.5% |
| Standard Deviation (Population) | 1.9% | 1.5% |
Similar Demographics by 6th Grade
Demographics Similar to Whites/Caucasians by 6th Grade
In terms of 6th grade, the demographic groups most similar to Whites/Caucasians are Greek (97.7%, a difference of 0.0%), Austrian (97.7%, a difference of 0.010%), American (97.7%, a difference of 0.010%), Creek (97.7%, a difference of 0.020%), and Aleut (97.7%, a difference of 0.020%).
| Demographics | Rating | Rank | 6th Grade |
| Immigrants | Scotland | 99.8 /100 | #50 | Exceptional 97.8% |
| Maltese | 99.8 /100 | #51 | Exceptional 97.8% |
| Australians | 99.8 /100 | #52 | Exceptional 97.8% |
| Slavs | 99.8 /100 | #53 | Exceptional 97.8% |
| Creek | 99.8 /100 | #54 | Exceptional 97.7% |
| Aleuts | 99.8 /100 | #55 | Exceptional 97.7% |
| Austrians | 99.8 /100 | #56 | Exceptional 97.7% |
| Whites/Caucasians | 99.8 /100 | #57 | Exceptional 97.7% |
| Greeks | 99.8 /100 | #58 | Exceptional 97.7% |
| Americans | 99.8 /100 | #59 | Exceptional 97.7% |
| Immigrants | Canada | 99.8 /100 | #60 | Exceptional 97.7% |
| Serbians | 99.7 /100 | #61 | Exceptional 97.7% |
| Immigrants | North America | 99.7 /100 | #62 | Exceptional 97.7% |
| Russians | 99.7 /100 | #63 | Exceptional 97.7% |
| Canadians | 99.7 /100 | #64 | Exceptional 97.7% |
Demographics Similar to Immigrants from Micronesia by 6th Grade
In terms of 6th grade, the demographic groups most similar to Immigrants from Micronesia are Immigrants from Kazakhstan (97.0%, a difference of 0.0%), Mongolian (97.0%, a difference of 0.0%), Arab (97.0%, a difference of 0.010%), Venezuelan (97.0%, a difference of 0.010%), and Pakistani (97.0%, a difference of 0.010%).
| Demographics | Rating | Rank | 6th Grade |
| Bermudans | 52.6 /100 | #169 | Average 97.1% |
| Chileans | 52.1 /100 | #170 | Average 97.1% |
| Immigrants | Sri Lanka | 51.7 /100 | #171 | Average 97.1% |
| Egyptians | 50.9 /100 | #172 | Average 97.1% |
| Arabs | 50.1 /100 | #173 | Average 97.0% |
| Venezuelans | 50.0 /100 | #174 | Average 97.0% |
| Immigrants | Kazakhstan | 47.3 /100 | #175 | Average 97.0% |
| Immigrants | Micronesia | 47.1 /100 | #176 | Average 97.0% |
| Mongolians | 46.7 /100 | #177 | Average 97.0% |
| Pakistanis | 46.0 /100 | #178 | Average 97.0% |
| Immigrants | Kenya | 45.3 /100 | #179 | Average 97.0% |
| Immigrants | Spain | 39.9 /100 | #180 | Fair 97.0% |
| Comanche | 37.9 /100 | #181 | Fair 97.0% |
| Immigrants | Ukraine | 35.6 /100 | #182 | Fair 97.0% |
| Immigrants | Venezuela | 34.5 /100 | #183 | Fair 97.0% |