White/Caucasian vs Immigrants from Latvia Unemployment Among Ages 16 to 19 years
COMPARE
White/Caucasian
Immigrants from Latvia
Unemployment Among Ages 16 to 19 years
Unemployment Among Ages 16 to 19 years Comparison
Whites/Caucasians
Immigrants from Latvia
16.8%
UNEMPLOYMENT AMONG AGES 16 TO 19 YEARS
97.5/ 100
METRIC RATING
82nd/ 347
METRIC RANK
16.8%
UNEMPLOYMENT AMONG AGES 16 TO 19 YEARS
97.5/ 100
METRIC RATING
81st/ 347
METRIC RANK
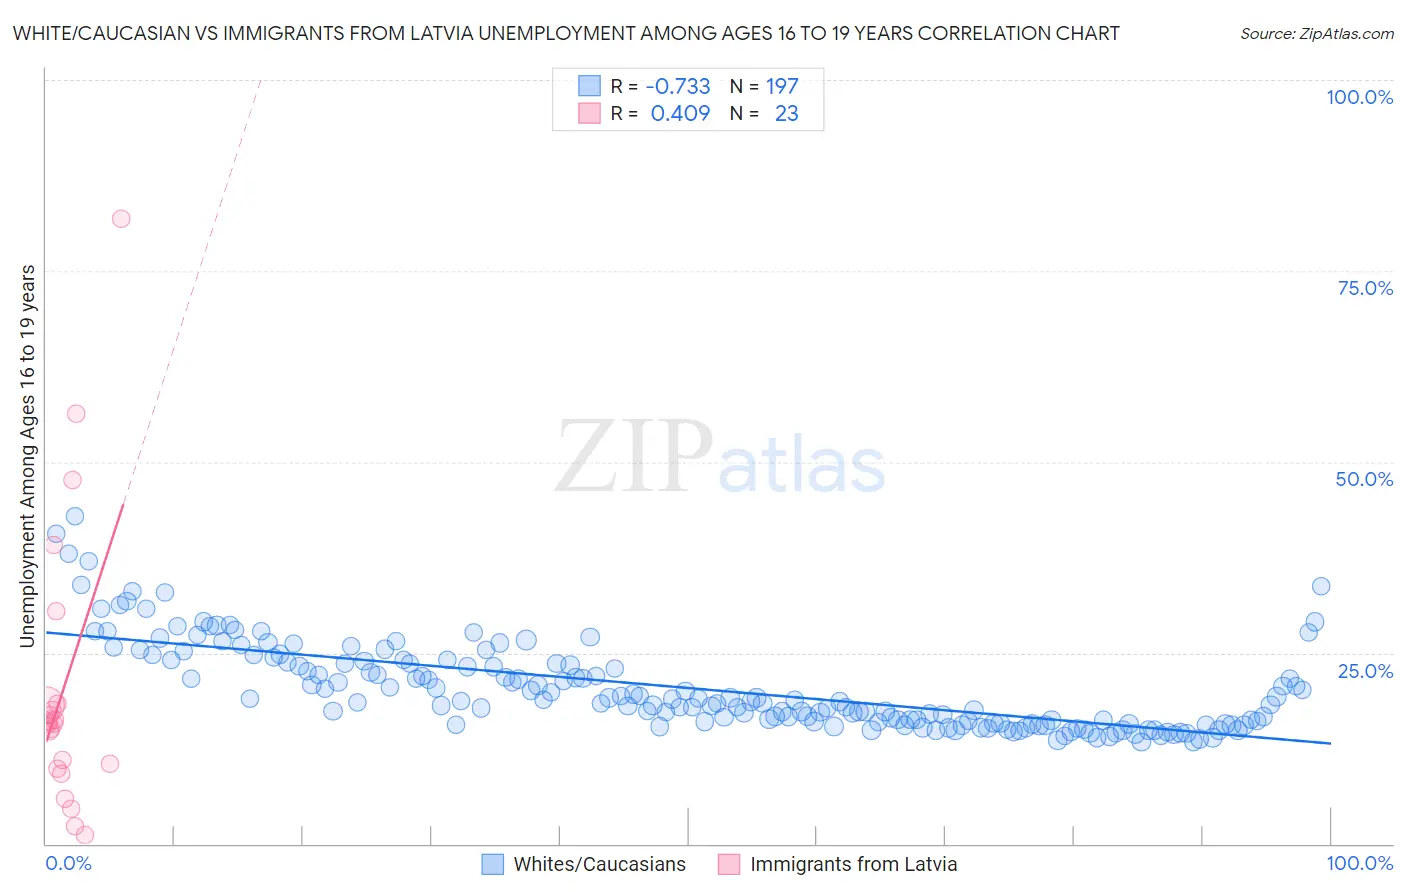
White/Caucasian vs Immigrants from Latvia Unemployment Among Ages 16 to 19 years Correlation Chart
The statistical analysis conducted on geographies consisting of 514,462,178 people shows a strong negative correlation between the proportion of Whites/Caucasians and unemployment rate among population between the ages 16 and 19 in the United States with a correlation coefficient (R) of -0.733 and weighted average of 16.8%. Similarly, the statistical analysis conducted on geographies consisting of 111,162,820 people shows a moderate positive correlation between the proportion of Immigrants from Latvia and unemployment rate among population between the ages 16 and 19 in the United States with a correlation coefficient (R) of 0.409 and weighted average of 16.8%, a difference of 0.010%.
Unemployment Among Ages 16 to 19 years Correlation Summary
| Measurement | White/Caucasian | Immigrants from Latvia |
| Minimum | 13.3% | 1.1% |
| Maximum | 42.8% | 81.8% |
| Range | 29.5% | 80.7% |
| Mean | 20.3% | 20.6% |
| Median | 18.7% | 15.8% |
| Interquartile 25% (IQ1) | 15.8% | 9.8% |
| Interquartile 75% (IQ3) | 23.7% | 18.4% |
| Interquartile Range (IQR) | 7.9% | 8.6% |
| Standard Deviation (Sample) | 5.7% | 19.1% |
| Standard Deviation (Population) | 5.6% | 18.7% |
Demographics Similar to Whites/Caucasians and Immigrants from Latvia by Unemployment Among Ages 16 to 19 years
In terms of unemployment among ages 16 to 19 years, the demographic groups most similar to Whites/Caucasians are Slovak (16.8%, a difference of 0.010%), French Canadian (16.8%, a difference of 0.010%), Ugandan (16.8%, a difference of 0.020%), French (16.8%, a difference of 0.050%), and Immigrants from Kuwait (16.8%, a difference of 0.13%). Similarly, the demographic groups most similar to Immigrants from Latvia are Slovak (16.8%, a difference of 0.0%), French Canadian (16.8%, a difference of 0.0%), Ugandan (16.8%, a difference of 0.020%), French (16.8%, a difference of 0.060%), and Immigrants from Kuwait (16.8%, a difference of 0.13%).
| Demographics | Rating | Rank | Unemployment Among Ages 16 to 19 years |
| Latvians | 98.5 /100 | #71 | Exceptional 16.7% |
| Immigrants | Canada | 98.5 /100 | #72 | Exceptional 16.7% |
| Lithuanians | 98.2 /100 | #73 | Exceptional 16.7% |
| Immigrants | Eastern Africa | 98.1 /100 | #74 | Exceptional 16.8% |
| New Zealanders | 98.0 /100 | #75 | Exceptional 16.8% |
| Immigrants | North America | 97.9 /100 | #76 | Exceptional 16.8% |
| Immigrants | Singapore | 97.8 /100 | #77 | Exceptional 16.8% |
| Soviet Union | 97.8 /100 | #78 | Exceptional 16.8% |
| Slovaks | 97.5 /100 | #79 | Exceptional 16.8% |
| French Canadians | 97.5 /100 | #80 | Exceptional 16.8% |
| Immigrants | Latvia | 97.5 /100 | #81 | Exceptional 16.8% |
| Whites/Caucasians | 97.5 /100 | #82 | Exceptional 16.8% |
| Ugandans | 97.4 /100 | #83 | Exceptional 16.8% |
| French | 97.4 /100 | #84 | Exceptional 16.8% |
| Immigrants | Kuwait | 97.2 /100 | #85 | Exceptional 16.8% |
| Immigrants | Scotland | 97.2 /100 | #86 | Exceptional 16.8% |
| Greeks | 97.0 /100 | #87 | Exceptional 16.9% |
| Immigrants | South Africa | 96.9 /100 | #88 | Exceptional 16.9% |
| Canadians | 96.7 /100 | #89 | Exceptional 16.9% |
| Asians | 96.6 /100 | #90 | Exceptional 16.9% |
| Cambodians | 96.3 /100 | #91 | Exceptional 16.9% |