West Indian vs French Canadian Family Households
COMPARE
West Indian
French Canadian
Family Households
Family Households Comparison
West Indians
French Canadians
63.1%
FAMILY HOUSEHOLDS
0.3/ 100
METRIC RATING
275th/ 347
METRIC RANK
63.7%
FAMILY HOUSEHOLDS
5.4/ 100
METRIC RATING
223rd/ 347
METRIC RANK
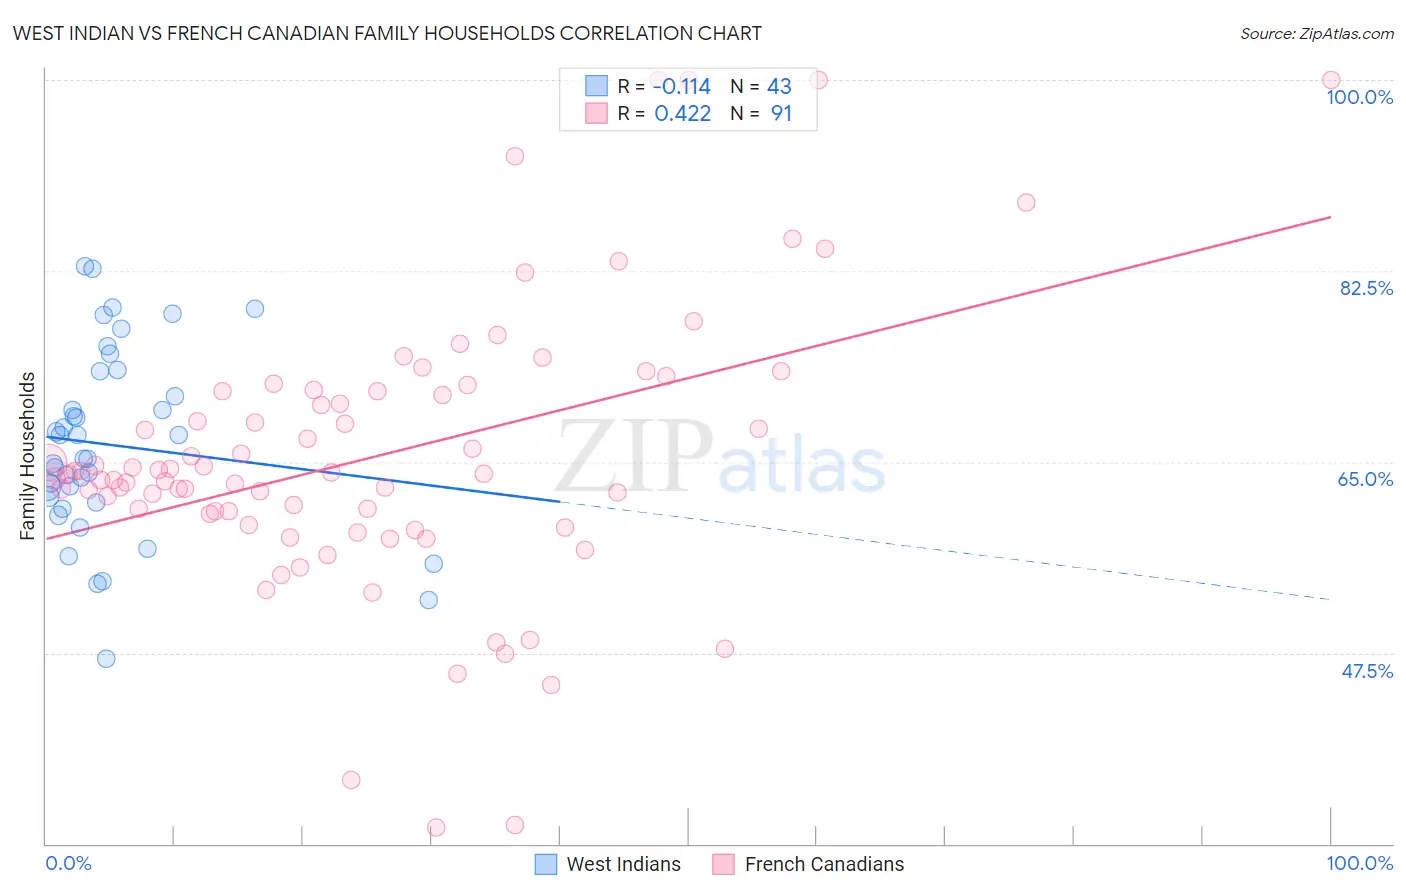
West Indian vs French Canadian Family Households Correlation Chart
The statistical analysis conducted on geographies consisting of 253,859,677 people shows a poor negative correlation between the proportion of West Indians and percentage of family households in the United States with a correlation coefficient (R) of -0.114 and weighted average of 63.1%. Similarly, the statistical analysis conducted on geographies consisting of 502,269,037 people shows a moderate positive correlation between the proportion of French Canadians and percentage of family households in the United States with a correlation coefficient (R) of 0.422 and weighted average of 63.7%, a difference of 0.99%.
Family Households Correlation Summary
| Measurement | West Indian | French Canadian |
| Minimum | 47.0% | 31.5% |
| Maximum | 83.0% | 100.0% |
| Range | 36.0% | 68.5% |
| Mean | 66.5% | 65.5% |
| Median | 65.3% | 63.9% |
| Interquartile 25% (IQ1) | 61.3% | 60.3% |
| Interquartile 75% (IQ3) | 73.3% | 71.5% |
| Interquartile Range (IQR) | 12.0% | 11.2% |
| Standard Deviation (Sample) | 8.5% | 12.9% |
| Standard Deviation (Population) | 8.4% | 12.9% |
Similar Demographics by Family Households
Demographics Similar to West Indians by Family Households
In terms of family households, the demographic groups most similar to West Indians are Lumbee (63.1%, a difference of 0.0%), Immigrants from Kazakhstan (63.1%, a difference of 0.010%), Serbian (63.0%, a difference of 0.010%), Immigrants from Croatia (63.1%, a difference of 0.020%), and Immigrants from Turkey (63.1%, a difference of 0.020%).
| Demographics | Rating | Rank | Family Households |
| Immigrants | Singapore | 0.4 /100 | #268 | Tragic 63.1% |
| Yugoslavians | 0.4 /100 | #269 | Tragic 63.1% |
| Immigrants | Austria | 0.3 /100 | #270 | Tragic 63.1% |
| Immigrants | Croatia | 0.3 /100 | #271 | Tragic 63.1% |
| Immigrants | Turkey | 0.3 /100 | #272 | Tragic 63.1% |
| Immigrants | Kazakhstan | 0.3 /100 | #273 | Tragic 63.1% |
| Lumbee | 0.3 /100 | #274 | Tragic 63.1% |
| West Indians | 0.3 /100 | #275 | Tragic 63.1% |
| Serbians | 0.3 /100 | #276 | Tragic 63.0% |
| Ottawa | 0.3 /100 | #277 | Tragic 63.0% |
| Immigrants | Belgium | 0.2 /100 | #278 | Tragic 63.0% |
| Immigrants | Yemen | 0.2 /100 | #279 | Tragic 63.0% |
| Immigrants | Bulgaria | 0.2 /100 | #280 | Tragic 63.0% |
| Estonians | 0.2 /100 | #281 | Tragic 62.9% |
| New Zealanders | 0.1 /100 | #282 | Tragic 62.9% |
Demographics Similar to French Canadians by Family Households
In terms of family households, the demographic groups most similar to French Canadians are Immigrants from Belarus (63.7%, a difference of 0.010%), Immigrants from South Africa (63.7%, a difference of 0.040%), Immigrants from Europe (63.7%, a difference of 0.060%), Macedonian (63.7%, a difference of 0.070%), and Turkish (63.6%, a difference of 0.070%).
| Demographics | Rating | Rank | Family Households |
| Croatians | 7.3 /100 | #216 | Tragic 63.8% |
| Osage | 7.0 /100 | #217 | Tragic 63.7% |
| Marshallese | 6.9 /100 | #218 | Tragic 63.7% |
| Macedonians | 6.5 /100 | #219 | Tragic 63.7% |
| Immigrants | Europe | 6.4 /100 | #220 | Tragic 63.7% |
| Immigrants | South Africa | 5.9 /100 | #221 | Tragic 63.7% |
| Immigrants | Belarus | 5.5 /100 | #222 | Tragic 63.7% |
| French Canadians | 5.4 /100 | #223 | Tragic 63.7% |
| Turks | 4.5 /100 | #224 | Tragic 63.6% |
| Immigrants | Hungary | 4.3 /100 | #225 | Tragic 63.6% |
| Immigrants | Bahamas | 4.2 /100 | #226 | Tragic 63.6% |
| Trinidadians and Tobagonians | 4.1 /100 | #227 | Tragic 63.6% |
| Blackfeet | 3.6 /100 | #228 | Tragic 63.6% |
| Bulgarians | 3.4 /100 | #229 | Tragic 63.6% |
| Immigrants | Brazil | 3.0 /100 | #230 | Tragic 63.6% |