Welsh vs Immigrants from Northern Africa Currently Married
COMPARE
Welsh
Immigrants from Northern Africa
Currently Married
Currently Married Comparison
Welsh
Immigrants from Northern Africa
48.9%
CURRENTLY MARRIED
99.5/ 100
METRIC RATING
28th/ 347
METRIC RANK
46.5%
CURRENTLY MARRIED
39.7/ 100
METRIC RATING
183rd/ 347
METRIC RANK
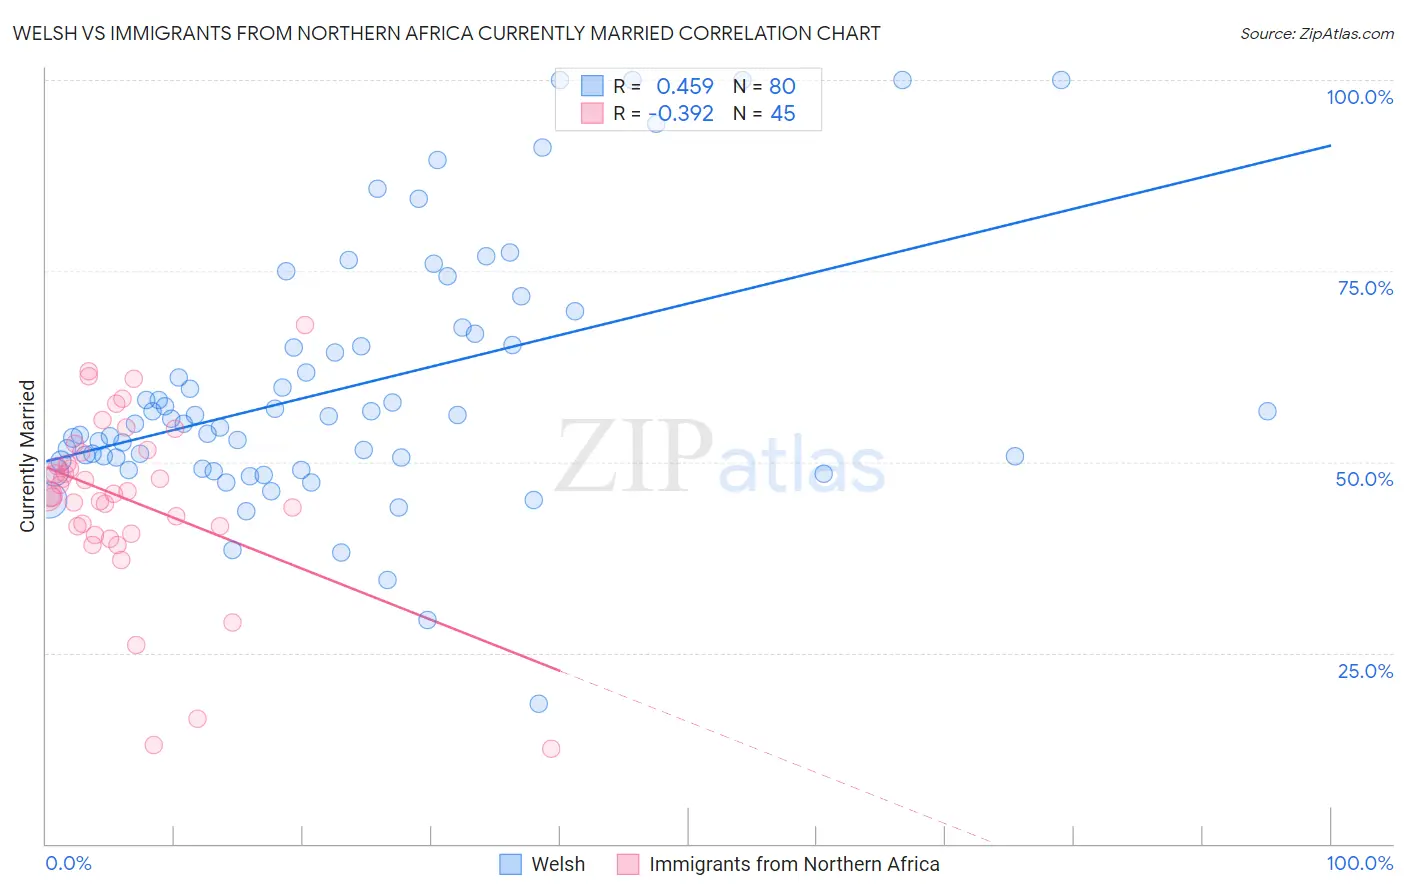
Welsh vs Immigrants from Northern Africa Currently Married Correlation Chart
The statistical analysis conducted on geographies consisting of 528,516,985 people shows a moderate positive correlation between the proportion of Welsh and percentage of population currently married in the United States with a correlation coefficient (R) of 0.459 and weighted average of 48.9%. Similarly, the statistical analysis conducted on geographies consisting of 321,174,675 people shows a mild negative correlation between the proportion of Immigrants from Northern Africa and percentage of population currently married in the United States with a correlation coefficient (R) of -0.392 and weighted average of 46.5%, a difference of 5.3%.
Currently Married Correlation Summary
| Measurement | Welsh | Immigrants from Northern Africa |
| Minimum | 18.4% | 12.5% |
| Maximum | 100.0% | 67.9% |
| Range | 81.6% | 55.4% |
| Mean | 59.7% | 45.1% |
| Median | 55.4% | 45.9% |
| Interquartile 25% (IQ1) | 49.6% | 41.1% |
| Interquartile 75% (IQ3) | 66.0% | 51.4% |
| Interquartile Range (IQR) | 16.4% | 10.3% |
| Standard Deviation (Sample) | 16.8% | 11.6% |
| Standard Deviation (Population) | 16.7% | 11.5% |
Similar Demographics by Currently Married
Demographics Similar to Welsh by Currently Married
In terms of currently married, the demographic groups most similar to Welsh are Burmese (48.9%, a difference of 0.040%), Croatian (48.9%, a difference of 0.050%), Eastern European (48.9%, a difference of 0.060%), Polish (48.9%, a difference of 0.060%), and Immigrants from Hong Kong (48.9%, a difference of 0.070%).
| Demographics | Rating | Rank | Currently Married |
| Scottish | 99.8 /100 | #21 | Exceptional 49.2% |
| Bulgarians | 99.7 /100 | #22 | Exceptional 49.1% |
| Immigrants | Pakistan | 99.7 /100 | #23 | Exceptional 49.1% |
| Lithuanians | 99.6 /100 | #24 | Exceptional 49.0% |
| Maltese | 99.6 /100 | #25 | Exceptional 49.0% |
| Immigrants | Korea | 99.6 /100 | #26 | Exceptional 49.0% |
| Burmese | 99.6 /100 | #27 | Exceptional 48.9% |
| Welsh | 99.5 /100 | #28 | Exceptional 48.9% |
| Croatians | 99.5 /100 | #29 | Exceptional 48.9% |
| Eastern Europeans | 99.5 /100 | #30 | Exceptional 48.9% |
| Poles | 99.5 /100 | #31 | Exceptional 48.9% |
| Immigrants | Hong Kong | 99.5 /100 | #32 | Exceptional 48.9% |
| Irish | 99.5 /100 | #33 | Exceptional 48.9% |
| Immigrants | Lithuania | 99.4 /100 | #34 | Exceptional 48.8% |
| Immigrants | Northern Europe | 99.4 /100 | #35 | Exceptional 48.8% |
Demographics Similar to Immigrants from Northern Africa by Currently Married
In terms of currently married, the demographic groups most similar to Immigrants from Northern Africa are Brazilian (46.4%, a difference of 0.020%), Potawatomi (46.5%, a difference of 0.080%), Mongolian (46.4%, a difference of 0.080%), Immigrants from Chile (46.4%, a difference of 0.11%), and Ottawa (46.5%, a difference of 0.13%).
| Demographics | Rating | Rank | Currently Married |
| Hawaiians | 48.6 /100 | #176 | Average 46.6% |
| Israelis | 48.6 /100 | #177 | Average 46.6% |
| Chickasaw | 47.8 /100 | #178 | Average 46.6% |
| Immigrants | Oceania | 44.6 /100 | #179 | Average 46.5% |
| Costa Ricans | 43.7 /100 | #180 | Average 46.5% |
| Ottawa | 43.0 /100 | #181 | Average 46.5% |
| Potawatomi | 41.9 /100 | #182 | Average 46.5% |
| Immigrants | Northern Africa | 39.7 /100 | #183 | Fair 46.5% |
| Brazilians | 39.3 /100 | #184 | Fair 46.4% |
| Mongolians | 37.6 /100 | #185 | Fair 46.4% |
| Immigrants | Chile | 36.8 /100 | #186 | Fair 46.4% |
| Immigrants | Peru | 35.3 /100 | #187 | Fair 46.4% |
| Colombians | 31.8 /100 | #188 | Fair 46.3% |
| Fijians | 30.3 /100 | #189 | Fair 46.3% |
| Choctaw | 29.1 /100 | #190 | Fair 46.3% |