Vietnamese vs Immigrants from Jamaica Married-couple Households
COMPARE
Vietnamese
Immigrants from Jamaica
Married-couple Households
Married-couple Households Comparison
Vietnamese
Immigrants from Jamaica
43.6%
MARRIED-COUPLE HOUSEHOLDS
0.2/ 100
METRIC RATING
262nd/ 347
METRIC RANK
40.7%
MARRIED-COUPLE HOUSEHOLDS
0.0/ 100
METRIC RATING
317th/ 347
METRIC RANK
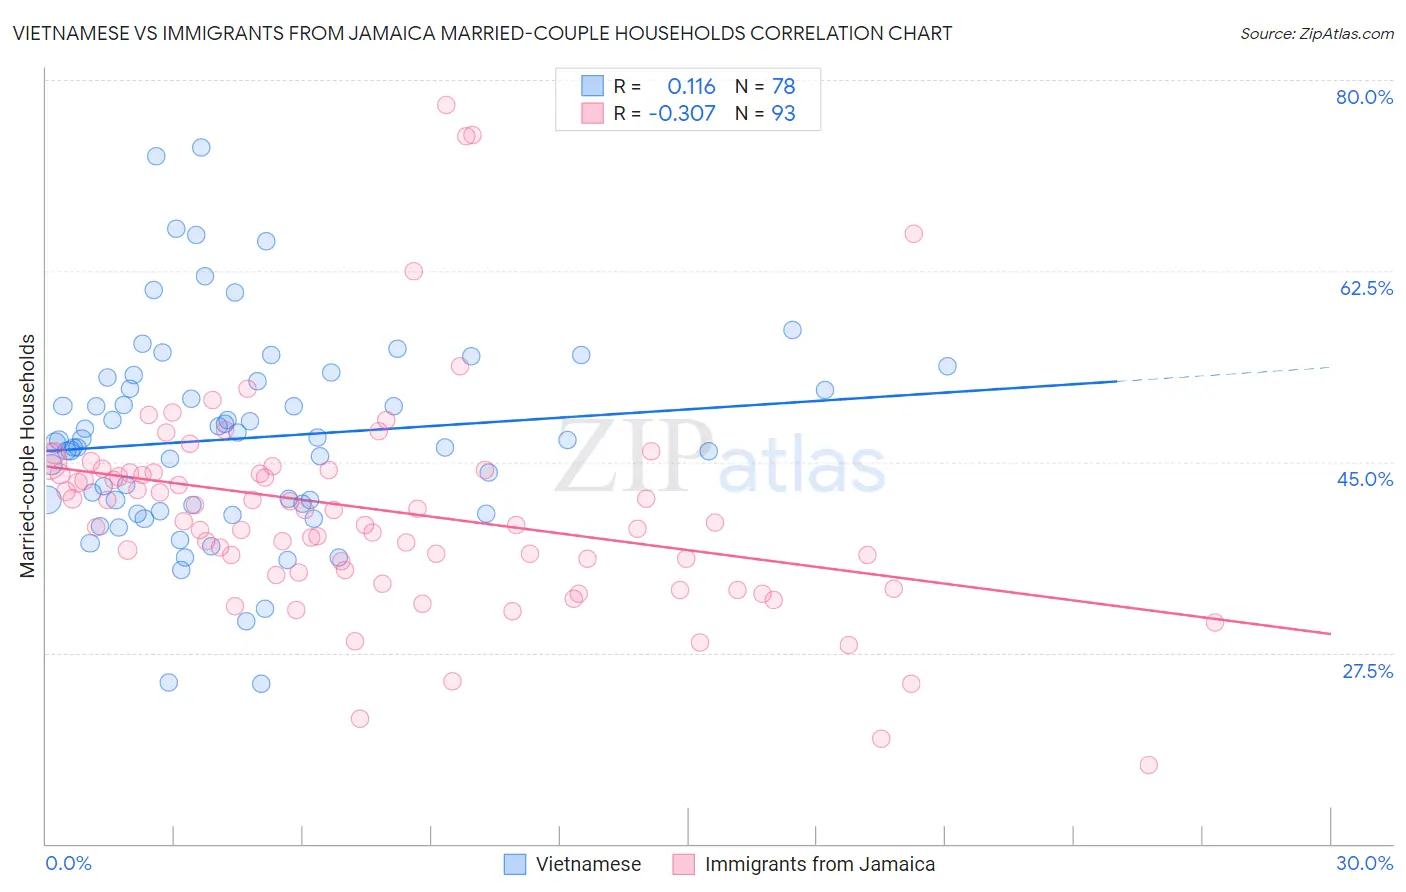
Vietnamese vs Immigrants from Jamaica Married-couple Households Correlation Chart
The statistical analysis conducted on geographies consisting of 170,654,128 people shows a poor positive correlation between the proportion of Vietnamese and percentage of married-couple family households in the United States with a correlation coefficient (R) of 0.116 and weighted average of 43.6%. Similarly, the statistical analysis conducted on geographies consisting of 301,578,290 people shows a mild negative correlation between the proportion of Immigrants from Jamaica and percentage of married-couple family households in the United States with a correlation coefficient (R) of -0.307 and weighted average of 40.7%, a difference of 7.3%.
Married-couple Households Correlation Summary
| Measurement | Vietnamese | Immigrants from Jamaica |
| Minimum | 24.7% | 17.2% |
| Maximum | 73.8% | 77.7% |
| Range | 49.1% | 60.5% |
| Mean | 47.2% | 40.6% |
| Median | 46.9% | 39.5% |
| Interquartile 25% (IQ1) | 41.0% | 35.0% |
| Interquartile 75% (IQ3) | 52.4% | 44.1% |
| Interquartile Range (IQR) | 11.4% | 9.1% |
| Standard Deviation (Sample) | 9.4% | 10.1% |
| Standard Deviation (Population) | 9.3% | 10.1% |
Similar Demographics by Married-couple Households
Demographics Similar to Vietnamese by Married-couple Households
In terms of married-couple households, the demographic groups most similar to Vietnamese are Alaskan Athabascan (43.6%, a difference of 0.060%), Cree (43.6%, a difference of 0.11%), Immigrants from Cameroon (43.7%, a difference of 0.19%), Bangladeshi (43.5%, a difference of 0.22%), and Iroquois (43.7%, a difference of 0.28%).
| Demographics | Rating | Rank | Married-couple Households |
| Shoshone | 0.3 /100 | #255 | Tragic 43.9% |
| Ugandans | 0.3 /100 | #256 | Tragic 43.8% |
| Blackfeet | 0.2 /100 | #257 | Tragic 43.8% |
| Central American Indians | 0.2 /100 | #258 | Tragic 43.8% |
| Iroquois | 0.2 /100 | #259 | Tragic 43.7% |
| Immigrants | Cameroon | 0.2 /100 | #260 | Tragic 43.7% |
| Alaskan Athabascans | 0.2 /100 | #261 | Tragic 43.6% |
| Vietnamese | 0.2 /100 | #262 | Tragic 43.6% |
| Cree | 0.1 /100 | #263 | Tragic 43.6% |
| Bangladeshis | 0.1 /100 | #264 | Tragic 43.5% |
| Moroccans | 0.1 /100 | #265 | Tragic 43.5% |
| Ecuadorians | 0.1 /100 | #266 | Tragic 43.5% |
| Natives/Alaskans | 0.1 /100 | #267 | Tragic 43.5% |
| Immigrants | Burma/Myanmar | 0.1 /100 | #268 | Tragic 43.4% |
| Immigrants | Sierra Leone | 0.1 /100 | #269 | Tragic 43.3% |
Demographics Similar to Immigrants from Jamaica by Married-couple Households
In terms of married-couple households, the demographic groups most similar to Immigrants from Jamaica are Liberian (40.7%, a difference of 0.010%), Immigrants from Caribbean (40.8%, a difference of 0.29%), Bahamian (40.5%, a difference of 0.36%), Trinidadian and Tobagonian (40.9%, a difference of 0.47%), and Jamaican (40.9%, a difference of 0.55%).
| Demographics | Rating | Rank | Married-couple Households |
| Haitians | 0.0 /100 | #310 | Tragic 41.2% |
| Colville | 0.0 /100 | #311 | Tragic 41.0% |
| Africans | 0.0 /100 | #312 | Tragic 40.9% |
| Immigrants | Haiti | 0.0 /100 | #313 | Tragic 40.9% |
| Jamaicans | 0.0 /100 | #314 | Tragic 40.9% |
| Trinidadians and Tobagonians | 0.0 /100 | #315 | Tragic 40.9% |
| Immigrants | Caribbean | 0.0 /100 | #316 | Tragic 40.8% |
| Immigrants | Jamaica | 0.0 /100 | #317 | Tragic 40.7% |
| Liberians | 0.0 /100 | #318 | Tragic 40.7% |
| Bahamians | 0.0 /100 | #319 | Tragic 40.5% |
| West Indians | 0.0 /100 | #320 | Tragic 40.3% |
| Immigrants | Liberia | 0.0 /100 | #321 | Tragic 40.3% |
| Immigrants | Zaire | 0.0 /100 | #322 | Tragic 40.1% |
| Puerto Ricans | 0.0 /100 | #323 | Tragic 40.1% |
| Navajo | 0.0 /100 | #324 | Tragic 40.1% |