Vietnamese vs Immigrants from Jamaica Disability Age Over 75
COMPARE
Vietnamese
Immigrants from Jamaica
Disability Age Over 75
Disability Age Over 75 Comparison
Vietnamese
Immigrants from Jamaica
47.9%
DISABILITY AGE OVER 75
11.9/ 100
METRIC RATING
210th/ 347
METRIC RANK
47.6%
DISABILITY AGE OVER 75
28.3/ 100
METRIC RATING
192nd/ 347
METRIC RANK
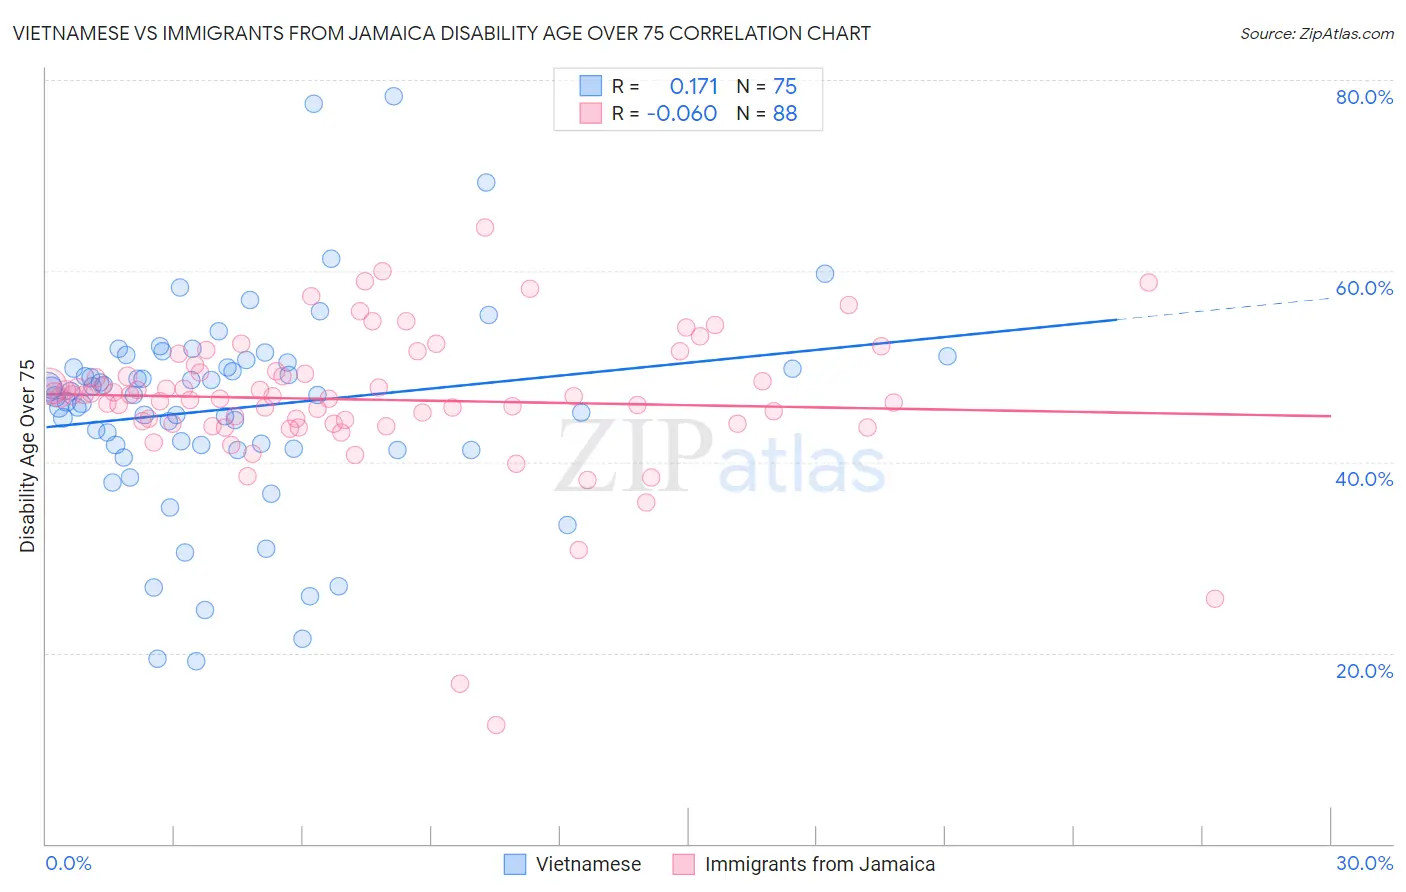
Vietnamese vs Immigrants from Jamaica Disability Age Over 75 Correlation Chart
The statistical analysis conducted on geographies consisting of 170,542,891 people shows a poor positive correlation between the proportion of Vietnamese and percentage of population with a disability over the age of 75 in the United States with a correlation coefficient (R) of 0.171 and weighted average of 47.9%. Similarly, the statistical analysis conducted on geographies consisting of 301,075,213 people shows a slight negative correlation between the proportion of Immigrants from Jamaica and percentage of population with a disability over the age of 75 in the United States with a correlation coefficient (R) of -0.060 and weighted average of 47.6%, a difference of 0.60%.
Disability Age Over 75 Correlation Summary
| Measurement | Vietnamese | Immigrants from Jamaica |
| Minimum | 19.1% | 12.5% |
| Maximum | 78.3% | 64.6% |
| Range | 59.2% | 52.1% |
| Mean | 45.6% | 46.5% |
| Median | 47.0% | 46.9% |
| Interquartile 25% (IQ1) | 41.4% | 44.1% |
| Interquartile 75% (IQ3) | 50.3% | 49.4% |
| Interquartile Range (IQR) | 8.9% | 5.4% |
| Standard Deviation (Sample) | 10.8% | 7.7% |
| Standard Deviation (Population) | 10.8% | 7.6% |
Demographics Similar to Vietnamese and Immigrants from Jamaica by Disability Age Over 75
In terms of disability age over 75, the demographic groups most similar to Vietnamese are Panamanian (47.9%, a difference of 0.010%), Immigrants from Indonesia (47.8%, a difference of 0.11%), Immigrants from Senegal (47.8%, a difference of 0.23%), Immigrants from Syria (47.8%, a difference of 0.25%), and Nigerian (47.7%, a difference of 0.31%). Similarly, the demographic groups most similar to Immigrants from Jamaica are Ottawa (47.6%, a difference of 0.0%), Portuguese (47.6%, a difference of 0.030%), Immigrants from Lebanon (47.6%, a difference of 0.050%), Immigrants from Trinidad and Tobago (47.6%, a difference of 0.080%), and Immigrants from Portugal (47.6%, a difference of 0.13%).
| Demographics | Rating | Rank | Disability Age Over 75 |
| Portuguese | 29.3 /100 | #191 | Fair 47.6% |
| Immigrants | Jamaica | 28.3 /100 | #192 | Fair 47.6% |
| Ottawa | 28.1 /100 | #193 | Fair 47.6% |
| Immigrants | Lebanon | 26.5 /100 | #194 | Fair 47.6% |
| Immigrants | Trinidad and Tobago | 25.3 /100 | #195 | Fair 47.6% |
| Immigrants | Portugal | 23.8 /100 | #196 | Fair 47.6% |
| Pakistanis | 23.4 /100 | #197 | Fair 47.7% |
| Immigrants | Ukraine | 23.2 /100 | #198 | Fair 47.7% |
| Immigrants | Eritrea | 22.4 /100 | #199 | Fair 47.7% |
| Immigrants | Somalia | 21.4 /100 | #200 | Fair 47.7% |
| Immigrants | Cuba | 20.9 /100 | #201 | Fair 47.7% |
| Immigrants | Bahamas | 20.7 /100 | #202 | Fair 47.7% |
| Trinidadians and Tobagonians | 20.0 /100 | #203 | Fair 47.7% |
| Nigerians | 19.2 /100 | #204 | Poor 47.7% |
| Immigrants | Ghana | 19.1 /100 | #205 | Poor 47.7% |
| Jamaicans | 19.0 /100 | #206 | Poor 47.7% |
| Immigrants | Syria | 17.4 /100 | #207 | Poor 47.8% |
| Immigrants | Senegal | 16.9 /100 | #208 | Poor 47.8% |
| Immigrants | Indonesia | 14.2 /100 | #209 | Poor 47.8% |
| Vietnamese | 11.9 /100 | #210 | Poor 47.9% |
| Panamanians | 11.8 /100 | #211 | Poor 47.9% |