Vietnamese vs Immigrants from Cameroon Married-couple Households
COMPARE
Vietnamese
Immigrants from Cameroon
Married-couple Households
Married-couple Households Comparison
Vietnamese
Immigrants from Cameroon
43.6%
MARRIED-COUPLE HOUSEHOLDS
0.2/ 100
METRIC RATING
262nd/ 347
METRIC RANK
43.7%
MARRIED-COUPLE HOUSEHOLDS
0.2/ 100
METRIC RATING
260th/ 347
METRIC RANK
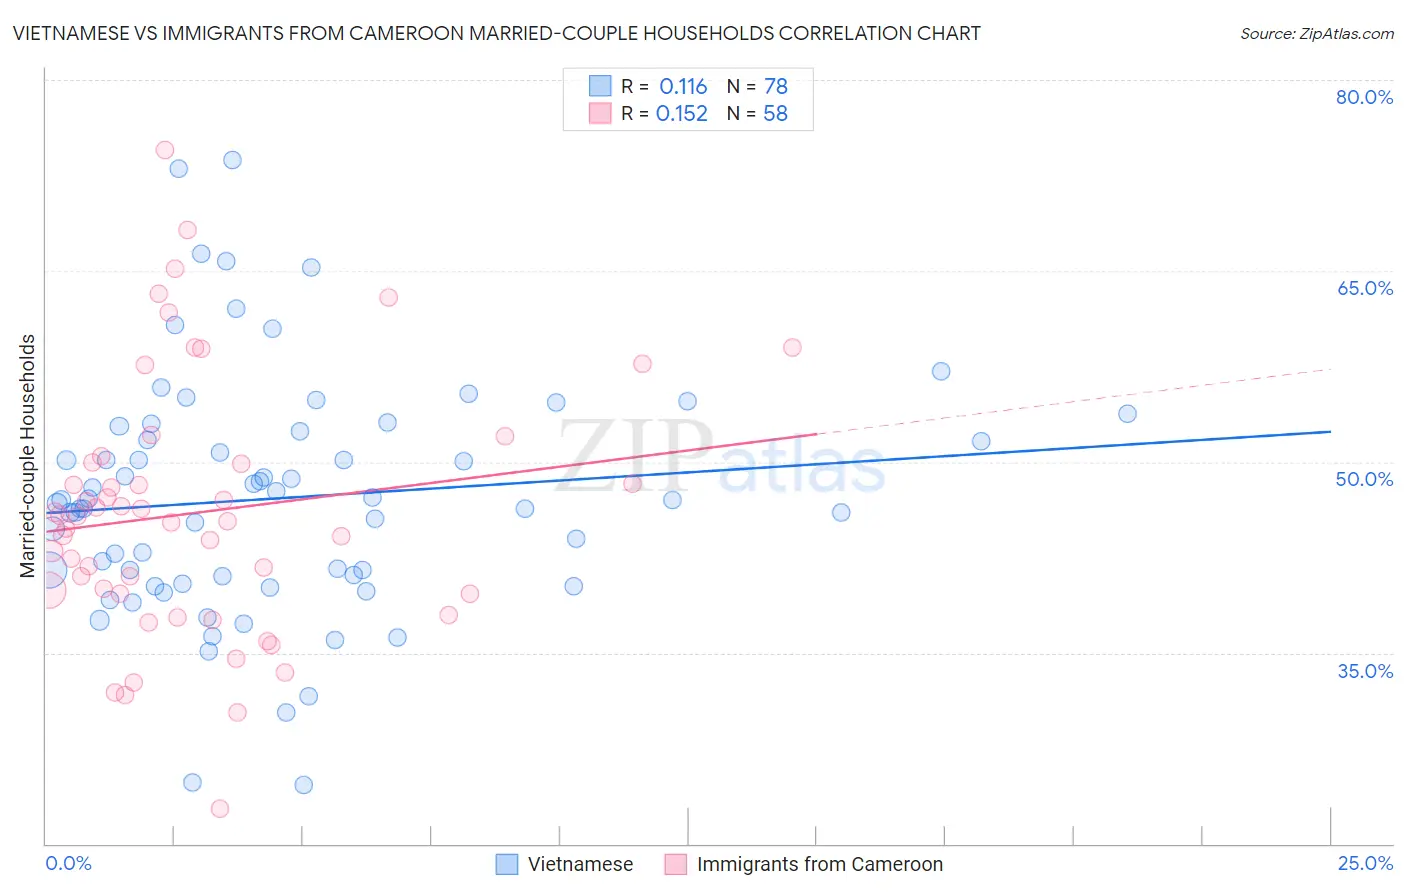
Vietnamese vs Immigrants from Cameroon Married-couple Households Correlation Chart
The statistical analysis conducted on geographies consisting of 170,654,128 people shows a poor positive correlation between the proportion of Vietnamese and percentage of married-couple family households in the United States with a correlation coefficient (R) of 0.116 and weighted average of 43.6%. Similarly, the statistical analysis conducted on geographies consisting of 130,731,618 people shows a poor positive correlation between the proportion of Immigrants from Cameroon and percentage of married-couple family households in the United States with a correlation coefficient (R) of 0.152 and weighted average of 43.7%, a difference of 0.19%.
Married-couple Households Correlation Summary
| Measurement | Vietnamese | Immigrants from Cameroon |
| Minimum | 24.7% | 22.8% |
| Maximum | 73.8% | 74.5% |
| Range | 49.1% | 51.8% |
| Mean | 47.2% | 46.0% |
| Median | 46.9% | 45.5% |
| Interquartile 25% (IQ1) | 41.0% | 39.6% |
| Interquartile 75% (IQ3) | 52.4% | 50.0% |
| Interquartile Range (IQR) | 11.4% | 10.4% |
| Standard Deviation (Sample) | 9.4% | 10.1% |
| Standard Deviation (Population) | 9.3% | 10.0% |
Demographics Similar to Vietnamese and Immigrants from Cameroon by Married-couple Households
In terms of married-couple households, the demographic groups most similar to Vietnamese are Alaskan Athabascan (43.6%, a difference of 0.060%), Cree (43.6%, a difference of 0.11%), Bangladeshi (43.5%, a difference of 0.22%), Iroquois (43.7%, a difference of 0.28%), and Central American Indian (43.8%, a difference of 0.30%). Similarly, the demographic groups most similar to Immigrants from Cameroon are Iroquois (43.7%, a difference of 0.090%), Central American Indian (43.8%, a difference of 0.12%), Alaskan Athabascan (43.6%, a difference of 0.13%), Blackfeet (43.8%, a difference of 0.15%), and Cree (43.6%, a difference of 0.30%).
| Demographics | Rating | Rank | Married-couple Households |
| German Russians | 0.4 /100 | #251 | Tragic 44.0% |
| Seminole | 0.4 /100 | #252 | Tragic 44.0% |
| Central Americans | 0.3 /100 | #253 | Tragic 43.9% |
| Apache | 0.3 /100 | #254 | Tragic 43.9% |
| Shoshone | 0.3 /100 | #255 | Tragic 43.9% |
| Ugandans | 0.3 /100 | #256 | Tragic 43.8% |
| Blackfeet | 0.2 /100 | #257 | Tragic 43.8% |
| Central American Indians | 0.2 /100 | #258 | Tragic 43.8% |
| Iroquois | 0.2 /100 | #259 | Tragic 43.7% |
| Immigrants | Cameroon | 0.2 /100 | #260 | Tragic 43.7% |
| Alaskan Athabascans | 0.2 /100 | #261 | Tragic 43.6% |
| Vietnamese | 0.2 /100 | #262 | Tragic 43.6% |
| Cree | 0.1 /100 | #263 | Tragic 43.6% |
| Bangladeshis | 0.1 /100 | #264 | Tragic 43.5% |
| Moroccans | 0.1 /100 | #265 | Tragic 43.5% |
| Ecuadorians | 0.1 /100 | #266 | Tragic 43.5% |
| Natives/Alaskans | 0.1 /100 | #267 | Tragic 43.5% |
| Immigrants | Burma/Myanmar | 0.1 /100 | #268 | Tragic 43.4% |
| Immigrants | Sierra Leone | 0.1 /100 | #269 | Tragic 43.3% |
| Yuman | 0.1 /100 | #270 | Tragic 43.3% |
| Guatemalans | 0.1 /100 | #271 | Tragic 43.3% |