Vietnamese vs Alsatian Currently Married

COMPARE

Vietnamese
Race
Ancestry
AfghanAfricanAlaska NativeAlaskan AthabascanAlbanianAleutAmericanApacheArabArapahoArgentineanArmenianAssyrian/Chaldean/SyriacAustralianAustrianBahamianBangladeshiBarbadianBasqueBelgianBelizeanBermudanBhutaneseBlackfeetBolivianBrazilianBritishBritish West IndianBulgarianBurmeseCajunCambodianCanadianCape VerdeanCarpatho RusynCelticCentral AmericanCentral American IndianCherokeeCheyenneChickasawChileanChineseChippewaChoctawColombianColvilleComancheCosta RicanCreeCreekCroatianCrowCubanCypriotCzechCzechoslovakianDanishDelawareDominicanDutchDutch West IndianEastern EuropeanEcuadorianEgyptianEnglishEstonianEthiopianEuropeanFijianFilipinoFinnishFrenchFrench American IndianFrench CanadianGermanGerman RussianGhanaianGreekGuamanian/ChamorroGuatemalanGuyaneseHaitianHmongHonduranHopiHoumaHungarianIcelanderIndian (Asian)IndonesianInupiatIranianIraqiIrishIroquoisIsraeliItalianJamaicanJapaneseJordanianKenyanKiowaKoreanLaotianLatvianLebaneseLiberianLithuanianLumbeeLuxembourgerMacedonianMalaysianMalteseMarshalleseMenomineeMexicanMexican American IndianMongolianMoroccanNative HawaiianNavajoNepaleseNew ZealanderNicaraguanNigerianNorthern EuropeanNorwegianOkinawanOsageOttawaPaiutePakistaniPalestinianPanamanianParaguayanPennsylvania GermanPeruvianPimaPolishPortuguesePotawatomiPuebloPuerto RicanPuget Sound SalishRomanianRussianSalvadoranSamoanScandinavianScotch-IrishScottishSeminoleSenegaleseSerbianShoshoneSierra LeoneanSiouxSlavicSlovakSloveneSomaliSouth AfricanSouth AmericanSouth American IndianSoviet UnionSpaniardSpanishSpanish AmericanSpanish American IndianSri LankanSubsaharan AfricanSudaneseSwedishSwissSyrianTaiwaneseThaiTlingit-HaidaTohono O'OdhamTonganTrinidadian and TobagonianTsimshianTurkishU.S. Virgin IslanderUgandanUkrainianUruguayanUteVenezuelanVietnameseWelshWest IndianYakamaYaquiYugoslavianYumanYup'ikZimbabwean
Immigration
NonimmigrantsImmigrantsAfghanistanAfricaAlbaniaArgentinaArmeniaAsiaAustraliaAustriaBahamasBangladeshBarbadosBelarusBelgiumBelizeBoliviaBosnia and HerzegovinaBrazilBulgariaBurma/MyanmarCabo VerdeCambodiaCameroonCanadaCaribbeanCentral AmericaChileChinaColombiaCongoCosta RicaCroatiaCubaCzechoslovakiaDenmarkDominicaDominican RepublicEastern AfricaEastern AsiaEastern EuropeEcuadorEgyptEl SalvadorEnglandEritreaEthiopiaEuropeFijiFranceGermanyGhanaGreeceGrenadaGuatemalaGuyanaHaitiHondurasHong KongHungaryIndiaIndonesiaIranIraqIrelandIsraelItalyJamaicaJapanJordanKazakhstanKenyaKoreaKuwaitLaosLatin AmericaLatviaLebanonLiberiaLithuaniaMalaysiaMexicoMicronesiaMiddle AfricaMoldovaMoroccoNepalNetherlandsNicaraguaNigeriaNorth AmericaNorth MacedoniaNorthern AfricaNorthern EuropeNorwayOceaniaPakistanPanamaPeruPhilippinesPolandPortugalRomaniaRussiaSaudi ArabiaScotlandSenegalSerbiaSierra LeoneSingaporeSomaliaSouth AfricaSouth AmericaSouth Central AsiaSouth Eastern AsiaSouthern EuropeSpainSri LankaSt. Vincent and the GrenadinesSudanSwedenSwitzerlandSyriaTaiwanThailandTrinidad and TobagoTurkeyUgandaUkraineUruguayUzbekistanVenezuelaVietnamWest IndiesWestern AfricaWestern AsiaWestern EuropeYemenZaireZimbabweAzores
Alsatian
Race
Ancestry
AfghanAfricanAlaska NativeAlaskan AthabascanAlbanianAleutAlsatianAmericanApacheArabArapahoArgentineanArmenianAssyrian/Chaldean/SyriacAustralianAustrianBahamianBangladeshiBarbadianBasqueBelgianBelizeanBermudanBhutaneseBlackfeetBolivianBrazilianBritishBritish West IndianBulgarianBurmeseCajunCambodianCanadianCape VerdeanCarpatho RusynCelticCentral AmericanCentral American IndianCherokeeCheyenneChickasawChileanChineseChippewaChoctawColombianColvilleComancheCosta RicanCreeCreekCroatianCrowCubanCypriotCzechCzechoslovakianDanishDelawareDominicanDutchDutch West IndianEastern EuropeanEcuadorianEgyptianEnglishEstonianEthiopianEuropeanFijianFilipinoFinnishFrenchFrench American IndianFrench CanadianGermanGerman RussianGhanaianGreekGuamanian/ChamorroGuatemalanGuyaneseHaitianHmongHonduranHopiHoumaHungarianIcelanderIndian (Asian)IndonesianInupiatIranianIraqiIrishIroquoisIsraeliItalianJamaicanJapaneseJordanianKenyanKiowaKoreanLaotianLatvianLebaneseLiberianLithuanianLumbeeLuxembourgerMacedonianMalaysianMalteseMarshalleseMenomineeMexicanMexican American IndianMongolianMoroccanNative HawaiianNavajoNepaleseNew ZealanderNicaraguanNigerianNorthern EuropeanNorwegianOkinawanOsageOttawaPaiutePakistaniPalestinianPanamanianParaguayanPennsylvania GermanPeruvianPimaPolishPortuguesePotawatomiPuebloPuerto RicanPuget Sound SalishRomanianRussianSalvadoranSamoanScandinavianScotch-IrishScottishSeminoleSenegaleseSerbianShoshoneSierra LeoneanSiouxSlavicSlovakSloveneSomaliSouth AfricanSouth AmericanSouth American IndianSoviet UnionSpaniardSpanishSpanish AmericanSpanish American IndianSri LankanSubsaharan AfricanSudaneseSwedishSwissSyrianTaiwaneseThaiTlingit-HaidaTohono O'OdhamTonganTrinidadian and TobagonianTsimshianTurkishU.S. Virgin IslanderUgandanUkrainianUruguayanUteVenezuelanWelshWest IndianYakamaYaquiYugoslavianYumanYup'ikZimbabwean
Immigration
NonimmigrantsImmigrantsAfghanistanAfricaAlbaniaArgentinaArmeniaAsiaAustraliaAustriaBahamasBangladeshBarbadosBelarusBelgiumBelizeBoliviaBosnia and HerzegovinaBrazilBulgariaBurma/MyanmarCabo VerdeCambodiaCameroonCanadaCaribbeanCentral AmericaChileChinaColombiaCongoCosta RicaCroatiaCubaCzechoslovakiaDenmarkDominicaDominican RepublicEastern AfricaEastern AsiaEastern EuropeEcuadorEgyptEl SalvadorEnglandEritreaEthiopiaEuropeFijiFranceGermanyGhanaGreeceGrenadaGuatemalaGuyanaHaitiHondurasHong KongHungaryIndiaIndonesiaIranIraqIrelandIsraelItalyJamaicaJapanJordanKazakhstanKenyaKoreaKuwaitLaosLatin AmericaLatviaLebanonLiberiaLithuaniaMalaysiaMexicoMicronesiaMiddle AfricaMoldovaMoroccoNepalNetherlandsNicaraguaNigeriaNorth AmericaNorth MacedoniaNorthern AfricaNorthern EuropeNorwayOceaniaPakistanPanamaPeruPhilippinesPolandPortugalRomaniaRussiaSaudi ArabiaScotlandSenegalSerbiaSierra LeoneSingaporeSomaliaSouth AfricaSouth AmericaSouth Central AsiaSouth Eastern AsiaSouthern EuropeSpainSri LankaSt. Vincent and the GrenadinesSudanSwedenSwitzerlandSyriaTaiwanThailandTrinidad and TobagoTurkeyUgandaUkraineUruguayUzbekistanVenezuelaVietnamWest IndiesWestern AfricaWestern AsiaWestern EuropeYemenZaireZimbabweAzores
Currently Married
Income
Poverty
Unemployment
Labor Participation
Family Structure
Vehicle Availability
Education Level
Disability

Currently Married Comparison

Vietnamese

Alsatians

Tragic
Poor
44.0%
CURRENTLY MARRIED
0.2/ 100
METRIC RATING
254th/ 347
METRIC RANK
45.7%
CURRENTLY MARRIED
10.8/ 100
METRIC RATING
208th/ 347
METRIC RANK

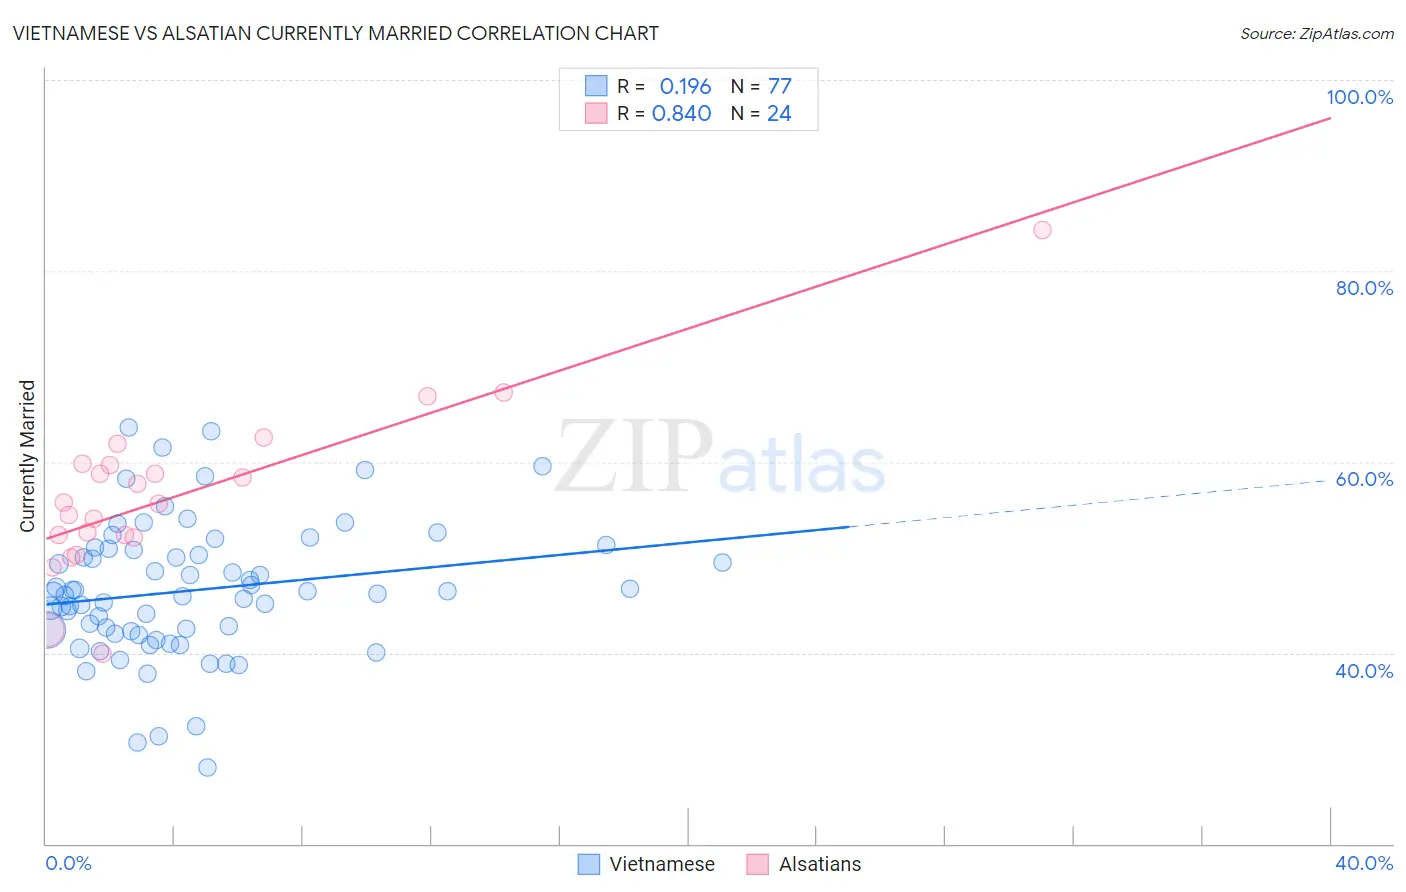
Vietnamese vs Alsatian Currently Married Correlation Chart

The statistical analysis conducted on geographies consisting of 170,739,773 people shows a poor positive correlation between the proportion of Vietnamese and percentage of population currently married in the United States with a correlation coefficient (R) of 0.196 and weighted average of 44.0%. Similarly, the statistical analysis conducted on geographies consisting of 82,681,658 people shows a very strong positive correlation between the proportion of Alsatians and percentage of population currently married in the United States with a correlation coefficient (R) of 0.840 and weighted average of 45.7%, a difference of 3.9%.
Vietnamese vs Alsatian Currently Married

Currently Married Correlation Summary

MeasurementVietnameseAlsatian
Minimum27.9%39.9%
Maximum63.6%84.3%
Range35.7%44.4%
Mean46.5%56.5%
Median46.3%55.7%
Interquartile 25% (IQ1)42.1%52.2%
Interquartile 75% (IQ3)50.8%59.7%
Interquartile Range (IQR)8.7%7.5%
Standard Deviation (Sample)7.1%8.8%
Standard Deviation (Population)7.0%8.6%

Similar Demographics by Currently Married

Demographics Similar to Vietnamese by Currently Married

In terms of currently married, the demographic groups most similar to Vietnamese are Yakama (44.0%, a difference of 0.070%), Shoshone (44.0%, a difference of 0.12%), Immigrants from Central America (44.1%, a difference of 0.24%), Hispanic or Latino (44.1%, a difference of 0.28%), and Blackfeet (44.2%, a difference of 0.30%).
DemographicsRating | RankCurrently Married
Ugandans
0.4
/100
|
#247
Tragic
44.2%
Nicaraguans
0.3
/100
|
#248
Tragic
44.2%
Immigrants | Cameroon
0.3
/100
|
#249
Tragic
44.2%
Immigrants | Eastern Africa
0.3
/100
|
#250
Tragic
44.2%
Blackfeet
0.3
/100
|
#251
Tragic
44.2%
Hispanics or Latinos
0.3
/100
|
#252
Tragic
44.1%
Immigrants | Central America
0.3
/100
|
#253
Tragic
44.1%
Vietnamese
0.2
/100
|
#254
Tragic
44.0%
Yakama
0.2
/100
|
#255
Tragic
44.0%
Shoshone
0.2
/100
|
#256
Tragic
44.0%
Immigrants | Africa
0.2
/100
|
#257
Tragic
43.9%
Ute
0.2
/100
|
#258
Tragic
43.9%
Immigrants | Sierra Leone
0.1
/100
|
#259
Tragic
43.8%
Immigrants | Latin America
0.1
/100
|
#260
Tragic
43.8%
Immigrants | Nicaragua
0.1
/100
|
#261
Tragic
43.7%

Demographics Similar to Alsatians by Currently Married

In terms of currently married, the demographic groups most similar to Alsatians are Immigrants from South America (45.7%, a difference of 0.010%), Immigrants (45.8%, a difference of 0.050%), South American Indian (45.8%, a difference of 0.070%), Immigrants from Spain (45.8%, a difference of 0.080%), and Taiwanese (45.8%, a difference of 0.090%).
DemographicsRating | RankCurrently Married
Malaysians
15.3
/100
|
#201
Poor
45.9%
Immigrants | Albania
14.5
/100
|
#202
Poor
45.9%
Taiwanese
11.7
/100
|
#203
Poor
45.8%
Immigrants | Spain
11.6
/100
|
#204
Poor
45.8%
South American Indians
11.5
/100
|
#205
Poor
45.8%
Immigrants | Immigrants
11.2
/100
|
#206
Poor
45.8%
Immigrants | South America
10.8
/100
|
#207
Poor
45.7%
Alsatians
10.8
/100
|
#208
Poor
45.7%
Immigrants | Micronesia
8.8
/100
|
#209
Tragic
45.6%
Uruguayans
7.9
/100
|
#210
Tragic
45.6%
Houma
7.2
/100
|
#211
Tragic
45.5%
Marshallese
7.2
/100
|
#212
Tragic
45.5%
Alaska Natives
7.0
/100
|
#213
Tragic
45.5%
Dutch West Indians
6.7
/100
|
#214
Tragic
45.5%
German Russians
6.7
/100
|
#215
Tragic
45.5%