Vietnamese vs Alsatian Unemployment Among Women with Children Under 18 years
COMPARE
Vietnamese
Alsatian
Unemployment Among Women with Children Under 18 years
Unemployment Among Women with Children Under 18 years Comparison
Vietnamese
Alsatians
6.5%
UNEMPLOYMENT AMONG WOMEN WITH CHILDREN UNDER 18 YEARS
0.0/ 100
METRIC RATING
304th/ 347
METRIC RANK
5.8%
UNEMPLOYMENT AMONG WOMEN WITH CHILDREN UNDER 18 YEARS
2.5/ 100
METRIC RATING
236th/ 347
METRIC RANK
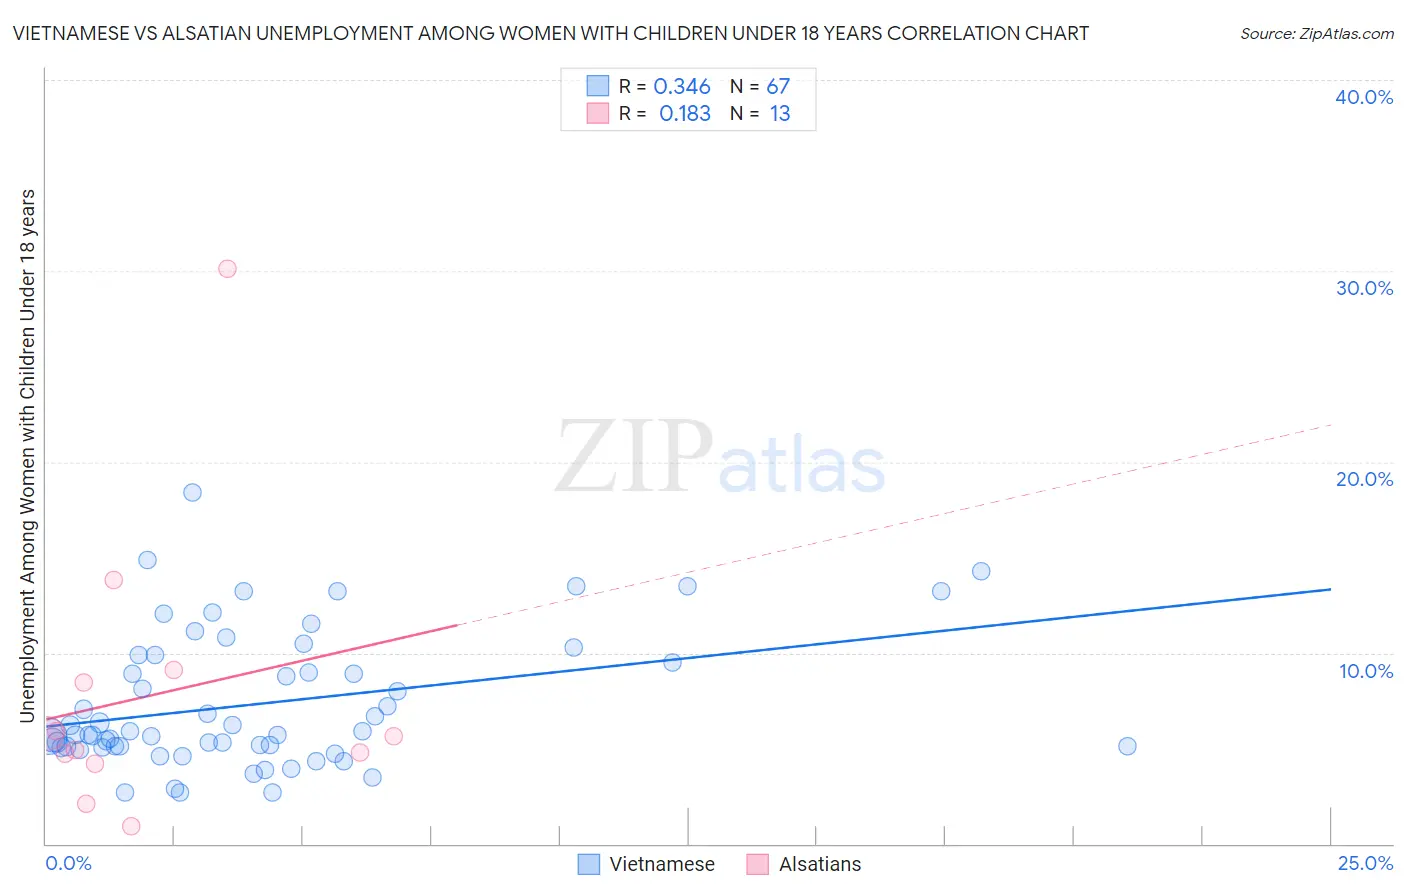
Vietnamese vs Alsatian Unemployment Among Women with Children Under 18 years Correlation Chart
The statistical analysis conducted on geographies consisting of 168,673,873 people shows a mild positive correlation between the proportion of Vietnamese and unemployment rate among women with children under the age of 18 in the United States with a correlation coefficient (R) of 0.346 and weighted average of 6.5%. Similarly, the statistical analysis conducted on geographies consisting of 81,370,800 people shows a poor positive correlation between the proportion of Alsatians and unemployment rate among women with children under the age of 18 in the United States with a correlation coefficient (R) of 0.183 and weighted average of 5.8%, a difference of 11.6%.
Unemployment Among Women with Children Under 18 years Correlation Summary
| Measurement | Vietnamese | Alsatian |
| Minimum | 2.7% | 0.90% |
| Maximum | 18.4% | 30.1% |
| Range | 15.7% | 29.2% |
| Mean | 7.3% | 7.7% |
| Median | 5.7% | 5.6% |
| Interquartile 25% (IQ1) | 5.1% | 4.5% |
| Interquartile 75% (IQ3) | 9.9% | 8.8% |
| Interquartile Range (IQR) | 4.8% | 4.3% |
| Standard Deviation (Sample) | 3.5% | 7.5% |
| Standard Deviation (Population) | 3.5% | 7.2% |
Similar Demographics by Unemployment Among Women with Children Under 18 years
Demographics Similar to Vietnamese by Unemployment Among Women with Children Under 18 years
In terms of unemployment among women with children under 18 years, the demographic groups most similar to Vietnamese are Immigrants from Honduras (6.5%, a difference of 0.0%), Immigrants from Armenia (6.5%, a difference of 0.24%), Immigrants from Haiti (6.4%, a difference of 0.49%), Immigrants from Jamaica (6.4%, a difference of 0.54%), and Jamaican (6.4%, a difference of 0.68%).
| Demographics | Rating | Rank | Unemployment Among Women with Children Under 18 years |
| Immigrants | Senegal | 0.0 /100 | #297 | Tragic 6.4% |
| Immigrants | Latin America | 0.0 /100 | #298 | Tragic 6.4% |
| Jamaicans | 0.0 /100 | #299 | Tragic 6.4% |
| Immigrants | Jamaica | 0.0 /100 | #300 | Tragic 6.4% |
| Immigrants | Haiti | 0.0 /100 | #301 | Tragic 6.4% |
| Immigrants | Armenia | 0.0 /100 | #302 | Tragic 6.5% |
| Immigrants | Honduras | 0.0 /100 | #303 | Tragic 6.5% |
| Vietnamese | 0.0 /100 | #304 | Tragic 6.5% |
| Immigrants | Central America | 0.0 /100 | #305 | Tragic 6.5% |
| Immigrants | Guyana | 0.0 /100 | #306 | Tragic 6.5% |
| Belizeans | 0.0 /100 | #307 | Tragic 6.5% |
| Africans | 0.0 /100 | #308 | Tragic 6.5% |
| Ecuadorians | 0.0 /100 | #309 | Tragic 6.5% |
| Guyanese | 0.0 /100 | #310 | Tragic 6.6% |
| Yaqui | 0.0 /100 | #311 | Tragic 6.6% |
Demographics Similar to Alsatians by Unemployment Among Women with Children Under 18 years
In terms of unemployment among women with children under 18 years, the demographic groups most similar to Alsatians are Immigrants from Lebanon (5.8%, a difference of 0.10%), Immigrants from Middle Africa (5.8%, a difference of 0.17%), Guamanian/Chamorro (5.8%, a difference of 0.21%), Immigrants from Somalia (5.8%, a difference of 0.28%), and Spanish American (5.8%, a difference of 0.32%).
| Demographics | Rating | Rank | Unemployment Among Women with Children Under 18 years |
| Immigrants | Panama | 3.4 /100 | #229 | Tragic 5.8% |
| Immigrants | South America | 3.2 /100 | #230 | Tragic 5.8% |
| Immigrants | Africa | 3.1 /100 | #231 | Tragic 5.8% |
| Creek | 3.1 /100 | #232 | Tragic 5.8% |
| Spanish Americans | 3.1 /100 | #233 | Tragic 5.8% |
| Guamanians/Chamorros | 2.9 /100 | #234 | Tragic 5.8% |
| Immigrants | Middle Africa | 2.8 /100 | #235 | Tragic 5.8% |
| Alsatians | 2.5 /100 | #236 | Tragic 5.8% |
| Immigrants | Lebanon | 2.4 /100 | #237 | Tragic 5.8% |
| Immigrants | Somalia | 2.2 /100 | #238 | Tragic 5.8% |
| Immigrants | Sierra Leone | 2.0 /100 | #239 | Tragic 5.8% |
| Immigrants | Immigrants | 2.0 /100 | #240 | Tragic 5.8% |
| Brazilians | 1.6 /100 | #241 | Tragic 5.8% |
| Moroccans | 1.4 /100 | #242 | Tragic 5.9% |
| Immigrants | Uruguay | 1.1 /100 | #243 | Tragic 5.9% |