Immigrants from Morocco vs Alsatian Currently Married
COMPARE
Immigrants from Morocco
Alsatian
Currently Married
Currently Married Comparison
Immigrants from Morocco
Alsatians
45.4%
CURRENTLY MARRIED
5.5/ 100
METRIC RATING
216th/ 347
METRIC RANK
45.7%
CURRENTLY MARRIED
10.8/ 100
METRIC RATING
208th/ 347
METRIC RANK
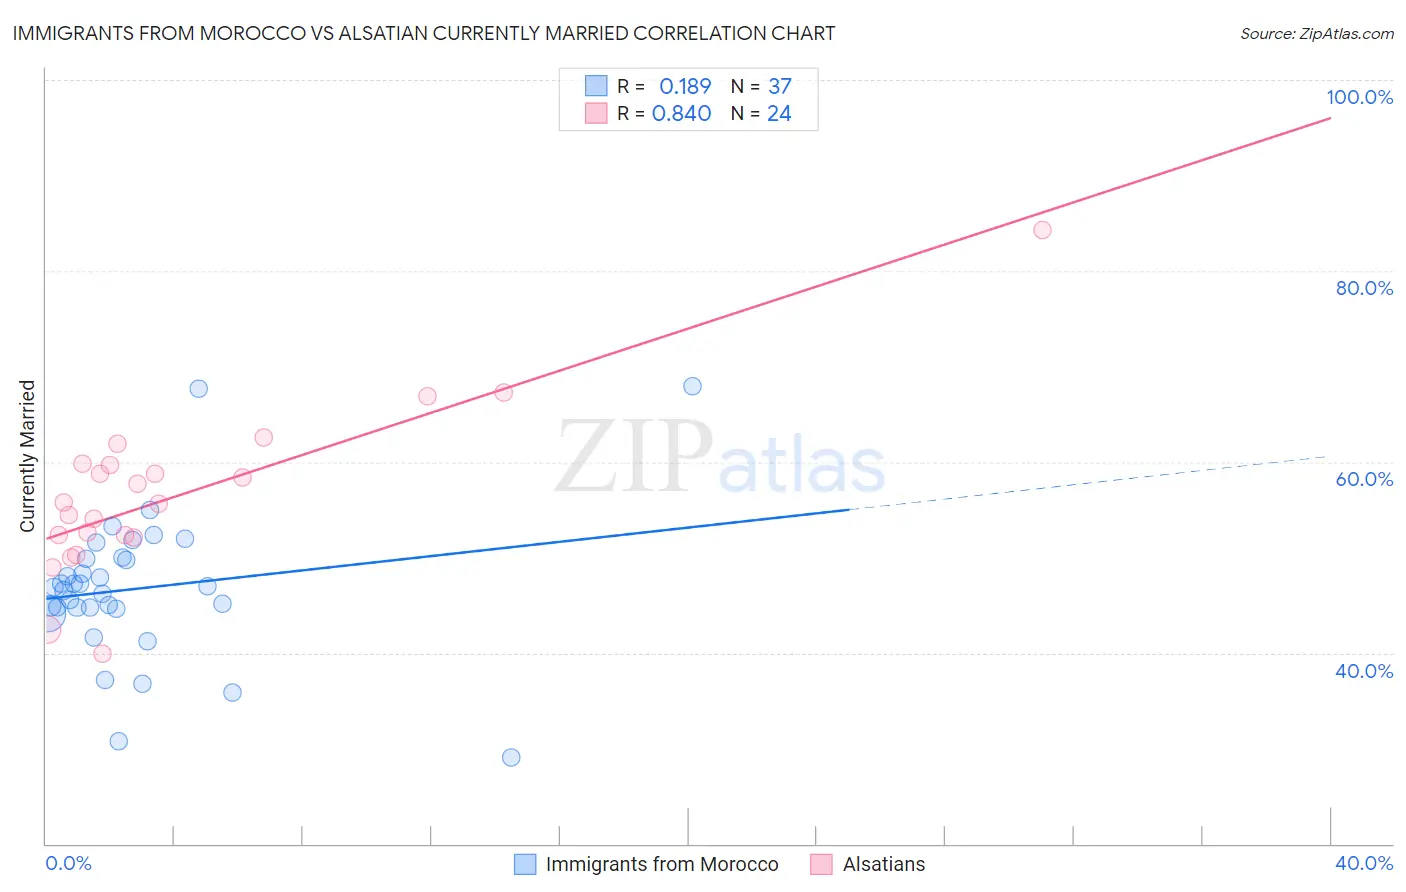
Immigrants from Morocco vs Alsatian Currently Married Correlation Chart
The statistical analysis conducted on geographies consisting of 178,912,438 people shows a poor positive correlation between the proportion of Immigrants from Morocco and percentage of population currently married in the United States with a correlation coefficient (R) of 0.189 and weighted average of 45.4%. Similarly, the statistical analysis conducted on geographies consisting of 82,681,658 people shows a very strong positive correlation between the proportion of Alsatians and percentage of population currently married in the United States with a correlation coefficient (R) of 0.840 and weighted average of 45.7%, a difference of 0.68%.
Currently Married Correlation Summary
| Measurement | Immigrants from Morocco | Alsatian |
| Minimum | 29.0% | 39.9% |
| Maximum | 67.9% | 84.3% |
| Range | 38.9% | 44.4% |
| Mean | 46.7% | 56.5% |
| Median | 46.9% | 55.7% |
| Interquartile 25% (IQ1) | 44.6% | 52.2% |
| Interquartile 75% (IQ3) | 49.9% | 59.7% |
| Interquartile Range (IQR) | 5.3% | 7.5% |
| Standard Deviation (Sample) | 7.6% | 8.8% |
| Standard Deviation (Population) | 7.5% | 8.6% |
Demographics Similar to Immigrants from Morocco and Alsatians by Currently Married
In terms of currently married, the demographic groups most similar to Immigrants from Morocco are Immigrants from Thailand (45.4%, a difference of 0.080%), Dutch West Indian (45.5%, a difference of 0.20%), German Russian (45.5%, a difference of 0.20%), Alaska Native (45.5%, a difference of 0.24%), and Houma (45.5%, a difference of 0.27%). Similarly, the demographic groups most similar to Alsatians are Immigrants from South America (45.7%, a difference of 0.010%), Immigrants (45.8%, a difference of 0.050%), South American Indian (45.8%, a difference of 0.070%), Immigrants from Spain (45.8%, a difference of 0.080%), and Taiwanese (45.8%, a difference of 0.090%).
| Demographics | Rating | Rank | Currently Married |
| Immigrants | Albania | 14.5 /100 | #202 | Poor 45.9% |
| Taiwanese | 11.7 /100 | #203 | Poor 45.8% |
| Immigrants | Spain | 11.6 /100 | #204 | Poor 45.8% |
| South American Indians | 11.5 /100 | #205 | Poor 45.8% |
| Immigrants | Immigrants | 11.2 /100 | #206 | Poor 45.8% |
| Immigrants | South America | 10.8 /100 | #207 | Poor 45.7% |
| Alsatians | 10.8 /100 | #208 | Poor 45.7% |
| Immigrants | Micronesia | 8.8 /100 | #209 | Tragic 45.6% |
| Uruguayans | 7.9 /100 | #210 | Tragic 45.6% |
| Houma | 7.2 /100 | #211 | Tragic 45.5% |
| Marshallese | 7.2 /100 | #212 | Tragic 45.5% |
| Alaska Natives | 7.0 /100 | #213 | Tragic 45.5% |
| Dutch West Indians | 6.7 /100 | #214 | Tragic 45.5% |
| German Russians | 6.7 /100 | #215 | Tragic 45.5% |
| Immigrants | Morocco | 5.5 /100 | #216 | Tragic 45.4% |
| Immigrants | Thailand | 5.1 /100 | #217 | Tragic 45.4% |
| Panamanians | 4.0 /100 | #218 | Tragic 45.3% |
| Immigrants | Portugal | 3.5 /100 | #219 | Tragic 45.2% |
| Kenyans | 3.1 /100 | #220 | Tragic 45.2% |
| Mexicans | 3.0 /100 | #221 | Tragic 45.2% |
| Immigrants | Azores | 2.5 /100 | #222 | Tragic 45.1% |