Vietnamese vs Okinawan Currently Married
COMPARE
Vietnamese
Okinawan
Currently Married
Currently Married Comparison
Vietnamese
Okinawans
44.0%
CURRENTLY MARRIED
0.2/ 100
METRIC RATING
254th/ 347
METRIC RANK
47.4%
CURRENTLY MARRIED
85.3/ 100
METRIC RATING
125th/ 347
METRIC RANK
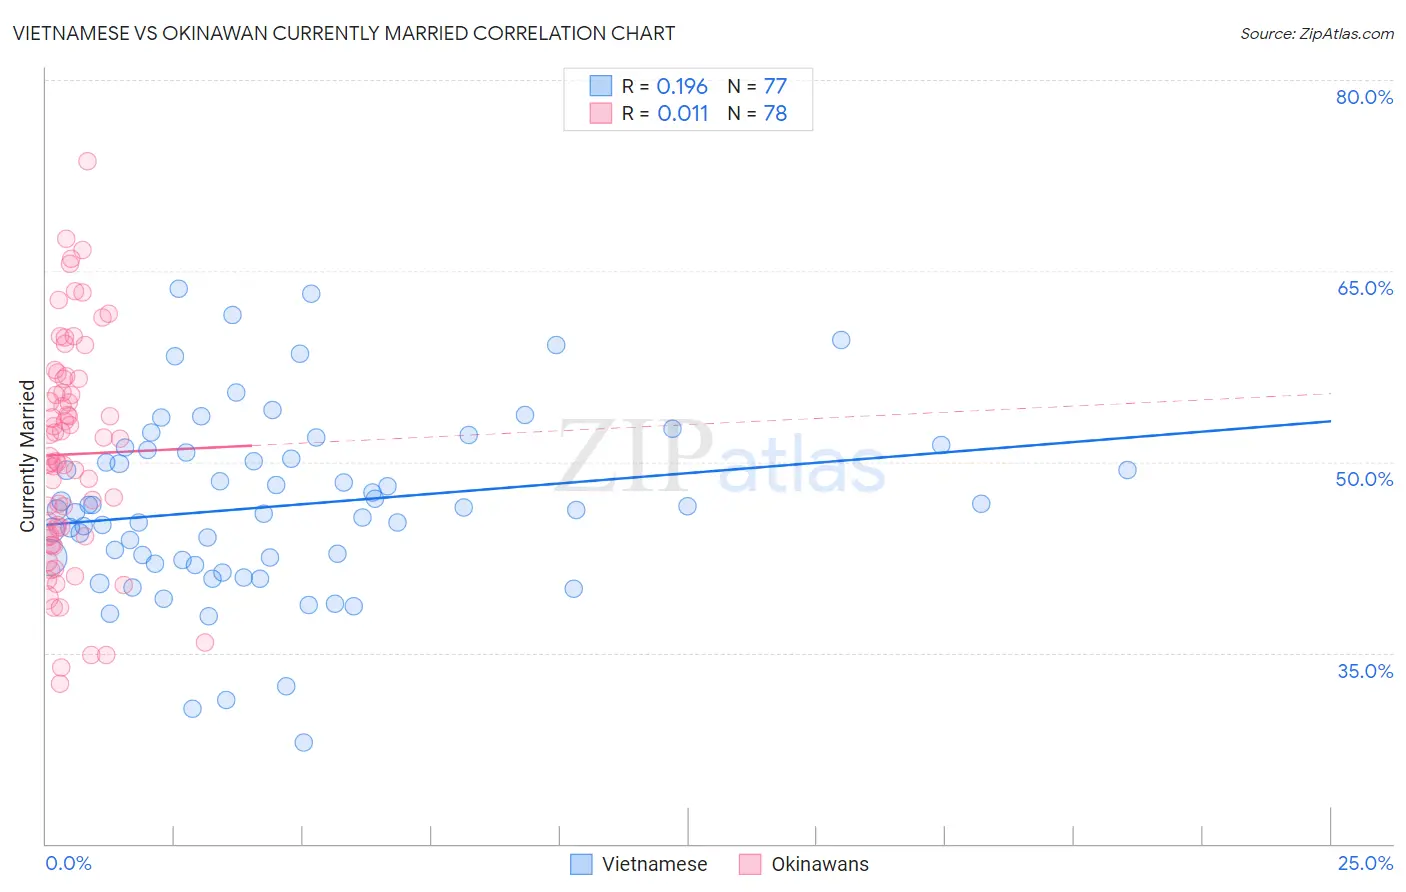
Vietnamese vs Okinawan Currently Married Correlation Chart
The statistical analysis conducted on geographies consisting of 170,739,773 people shows a poor positive correlation between the proportion of Vietnamese and percentage of population currently married in the United States with a correlation coefficient (R) of 0.196 and weighted average of 44.0%. Similarly, the statistical analysis conducted on geographies consisting of 73,772,528 people shows no correlation between the proportion of Okinawans and percentage of population currently married in the United States with a correlation coefficient (R) of 0.011 and weighted average of 47.4%, a difference of 7.6%.
Currently Married Correlation Summary
| Measurement | Vietnamese | Okinawan |
| Minimum | 27.9% | 32.6% |
| Maximum | 63.6% | 73.6% |
| Range | 35.7% | 41.0% |
| Mean | 46.5% | 50.6% |
| Median | 46.3% | 50.2% |
| Interquartile 25% (IQ1) | 42.1% | 44.2% |
| Interquartile 75% (IQ3) | 50.8% | 56.5% |
| Interquartile Range (IQR) | 8.7% | 12.3% |
| Standard Deviation (Sample) | 7.1% | 8.7% |
| Standard Deviation (Population) | 7.0% | 8.7% |
Similar Demographics by Currently Married
Demographics Similar to Vietnamese by Currently Married
In terms of currently married, the demographic groups most similar to Vietnamese are Yakama (44.0%, a difference of 0.070%), Shoshone (44.0%, a difference of 0.12%), Immigrants from Central America (44.1%, a difference of 0.24%), Hispanic or Latino (44.1%, a difference of 0.28%), and Blackfeet (44.2%, a difference of 0.30%).
| Demographics | Rating | Rank | Currently Married |
| Ugandans | 0.4 /100 | #247 | Tragic 44.2% |
| Nicaraguans | 0.3 /100 | #248 | Tragic 44.2% |
| Immigrants | Cameroon | 0.3 /100 | #249 | Tragic 44.2% |
| Immigrants | Eastern Africa | 0.3 /100 | #250 | Tragic 44.2% |
| Blackfeet | 0.3 /100 | #251 | Tragic 44.2% |
| Hispanics or Latinos | 0.3 /100 | #252 | Tragic 44.1% |
| Immigrants | Central America | 0.3 /100 | #253 | Tragic 44.1% |
| Vietnamese | 0.2 /100 | #254 | Tragic 44.0% |
| Yakama | 0.2 /100 | #255 | Tragic 44.0% |
| Shoshone | 0.2 /100 | #256 | Tragic 44.0% |
| Immigrants | Africa | 0.2 /100 | #257 | Tragic 43.9% |
| Ute | 0.2 /100 | #258 | Tragic 43.9% |
| Immigrants | Sierra Leone | 0.1 /100 | #259 | Tragic 43.8% |
| Immigrants | Latin America | 0.1 /100 | #260 | Tragic 43.8% |
| Immigrants | Nicaragua | 0.1 /100 | #261 | Tragic 43.7% |
Demographics Similar to Okinawans by Currently Married
In terms of currently married, the demographic groups most similar to Okinawans are Immigrants from Jordan (47.4%, a difference of 0.030%), New Zealander (47.4%, a difference of 0.030%), Portuguese (47.3%, a difference of 0.080%), Laotian (47.4%, a difference of 0.10%), and Sri Lankan (47.3%, a difference of 0.14%).
| Demographics | Rating | Rank | Currently Married |
| Immigrants | Philippines | 90.2 /100 | #118 | Exceptional 47.6% |
| Australians | 90.2 /100 | #119 | Exceptional 47.6% |
| Syrians | 88.9 /100 | #120 | Excellent 47.5% |
| Immigrants | Croatia | 88.6 /100 | #121 | Excellent 47.5% |
| Osage | 87.9 /100 | #122 | Excellent 47.5% |
| Immigrants | Kazakhstan | 87.2 /100 | #123 | Excellent 47.4% |
| Laotians | 86.6 /100 | #124 | Excellent 47.4% |
| Okinawans | 85.3 /100 | #125 | Excellent 47.4% |
| Immigrants | Jordan | 84.9 /100 | #126 | Excellent 47.4% |
| New Zealanders | 84.9 /100 | #127 | Excellent 47.4% |
| Portuguese | 84.2 /100 | #128 | Excellent 47.3% |
| Sri Lankans | 83.2 /100 | #129 | Excellent 47.3% |
| Immigrants | Iraq | 82.8 /100 | #130 | Excellent 47.3% |
| Icelanders | 82.4 /100 | #131 | Excellent 47.3% |
| Afghans | 81.8 /100 | #132 | Excellent 47.3% |