Vietnamese vs Immigrants from Bosnia and Herzegovina Currently Married
COMPARE
Vietnamese
Immigrants from Bosnia and Herzegovina
Currently Married
Currently Married Comparison
Vietnamese
Immigrants from Bosnia and Herzegovina
44.0%
CURRENTLY MARRIED
0.2/ 100
METRIC RATING
254th/ 347
METRIC RANK
46.1%
CURRENTLY MARRIED
22.2/ 100
METRIC RATING
196th/ 347
METRIC RANK
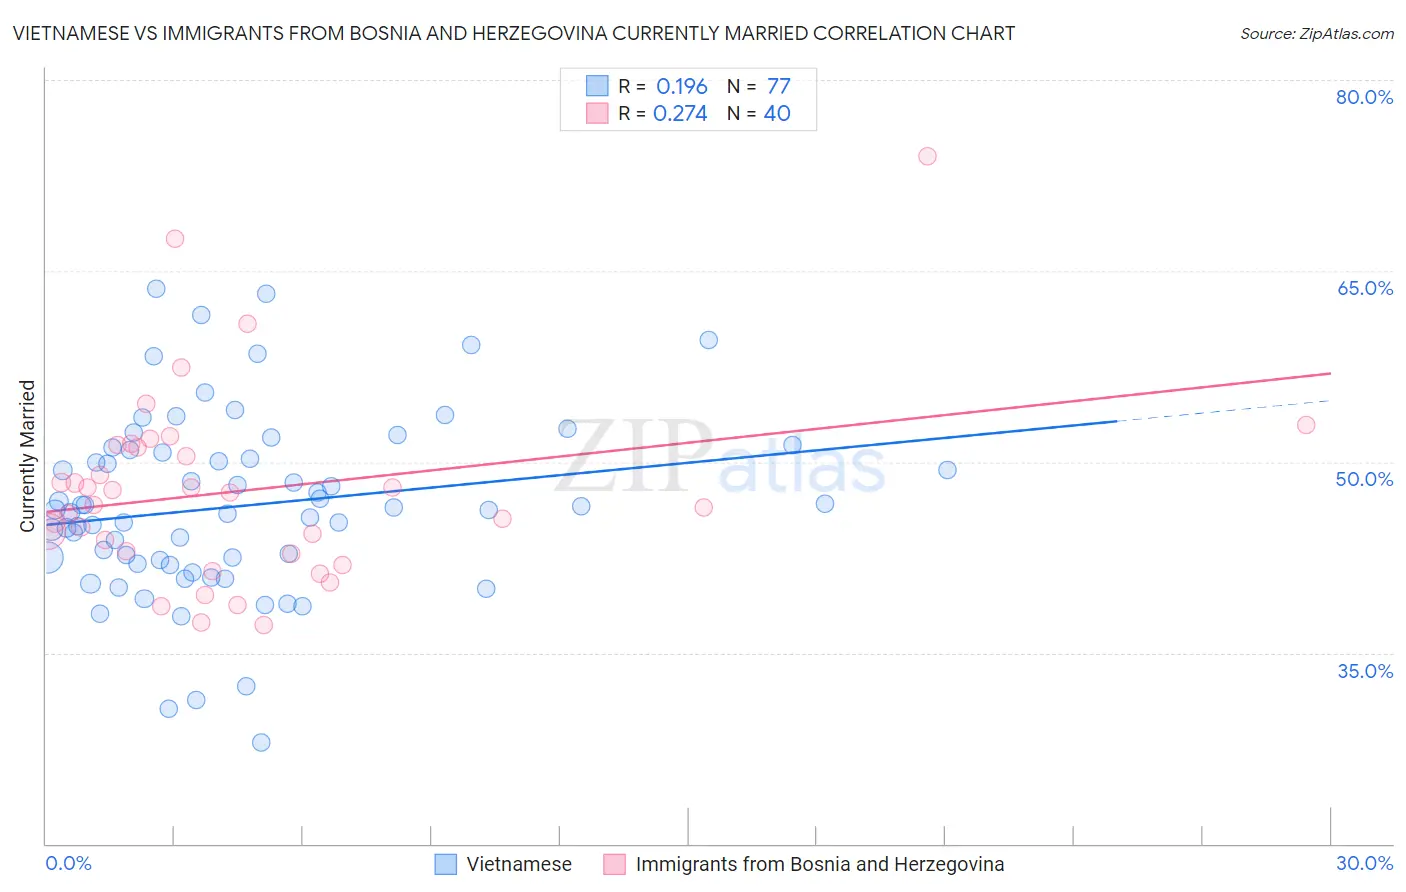
Vietnamese vs Immigrants from Bosnia and Herzegovina Currently Married Correlation Chart
The statistical analysis conducted on geographies consisting of 170,739,773 people shows a poor positive correlation between the proportion of Vietnamese and percentage of population currently married in the United States with a correlation coefficient (R) of 0.196 and weighted average of 44.0%. Similarly, the statistical analysis conducted on geographies consisting of 156,809,544 people shows a weak positive correlation between the proportion of Immigrants from Bosnia and Herzegovina and percentage of population currently married in the United States with a correlation coefficient (R) of 0.274 and weighted average of 46.1%, a difference of 4.7%.
Currently Married Correlation Summary
| Measurement | Vietnamese | Immigrants from Bosnia and Herzegovina |
| Minimum | 27.9% | 37.2% |
| Maximum | 63.6% | 74.0% |
| Range | 35.7% | 36.8% |
| Mean | 46.5% | 47.8% |
| Median | 46.3% | 47.1% |
| Interquartile 25% (IQ1) | 42.1% | 42.9% |
| Interquartile 75% (IQ3) | 50.8% | 51.3% |
| Interquartile Range (IQR) | 8.7% | 8.4% |
| Standard Deviation (Sample) | 7.1% | 7.6% |
| Standard Deviation (Population) | 7.0% | 7.5% |
Similar Demographics by Currently Married
Demographics Similar to Vietnamese by Currently Married
In terms of currently married, the demographic groups most similar to Vietnamese are Yakama (44.0%, a difference of 0.070%), Shoshone (44.0%, a difference of 0.12%), Immigrants from Central America (44.1%, a difference of 0.24%), Hispanic or Latino (44.1%, a difference of 0.28%), and Blackfeet (44.2%, a difference of 0.30%).
| Demographics | Rating | Rank | Currently Married |
| Ugandans | 0.4 /100 | #247 | Tragic 44.2% |
| Nicaraguans | 0.3 /100 | #248 | Tragic 44.2% |
| Immigrants | Cameroon | 0.3 /100 | #249 | Tragic 44.2% |
| Immigrants | Eastern Africa | 0.3 /100 | #250 | Tragic 44.2% |
| Blackfeet | 0.3 /100 | #251 | Tragic 44.2% |
| Hispanics or Latinos | 0.3 /100 | #252 | Tragic 44.1% |
| Immigrants | Central America | 0.3 /100 | #253 | Tragic 44.1% |
| Vietnamese | 0.2 /100 | #254 | Tragic 44.0% |
| Yakama | 0.2 /100 | #255 | Tragic 44.0% |
| Shoshone | 0.2 /100 | #256 | Tragic 44.0% |
| Immigrants | Africa | 0.2 /100 | #257 | Tragic 43.9% |
| Ute | 0.2 /100 | #258 | Tragic 43.9% |
| Immigrants | Sierra Leone | 0.1 /100 | #259 | Tragic 43.8% |
| Immigrants | Latin America | 0.1 /100 | #260 | Tragic 43.8% |
| Immigrants | Nicaragua | 0.1 /100 | #261 | Tragic 43.7% |
Demographics Similar to Immigrants from Bosnia and Herzegovina by Currently Married
In terms of currently married, the demographic groups most similar to Immigrants from Bosnia and Herzegovina are Immigrants from Kuwait (46.1%, a difference of 0.030%), Immigrants from Nepal (46.1%, a difference of 0.070%), Immigrants from Colombia (46.1%, a difference of 0.070%), South American (46.1%, a difference of 0.080%), and Immigrants from Fiji (46.2%, a difference of 0.14%).
| Demographics | Rating | Rank | Currently Married |
| Fijians | 30.3 /100 | #189 | Fair 46.3% |
| Choctaw | 29.1 /100 | #190 | Fair 46.3% |
| Immigrants | France | 27.7 /100 | #191 | Fair 46.2% |
| Soviet Union | 25.7 /100 | #192 | Fair 46.2% |
| Immigrants | Fiji | 25.0 /100 | #193 | Fair 46.2% |
| South Americans | 23.8 /100 | #194 | Fair 46.1% |
| Immigrants | Nepal | 23.7 /100 | #195 | Fair 46.1% |
| Immigrants | Bosnia and Herzegovina | 22.2 /100 | #196 | Fair 46.1% |
| Immigrants | Kuwait | 21.7 /100 | #197 | Fair 46.1% |
| Immigrants | Colombia | 21.0 /100 | #198 | Fair 46.1% |
| Immigrants | Costa Rica | 19.6 /100 | #199 | Poor 46.0% |
| Creek | 17.2 /100 | #200 | Poor 46.0% |
| Malaysians | 15.3 /100 | #201 | Poor 45.9% |
| Immigrants | Albania | 14.5 /100 | #202 | Poor 45.9% |
| Taiwanese | 11.7 /100 | #203 | Poor 45.8% |