Syrian vs Alsatian Currently Married
COMPARE
Syrian
Alsatian
Currently Married
Currently Married Comparison
Syrians
Alsatians
47.5%
CURRENTLY MARRIED
88.9/ 100
METRIC RATING
120th/ 347
METRIC RANK
45.7%
CURRENTLY MARRIED
10.8/ 100
METRIC RATING
208th/ 347
METRIC RANK
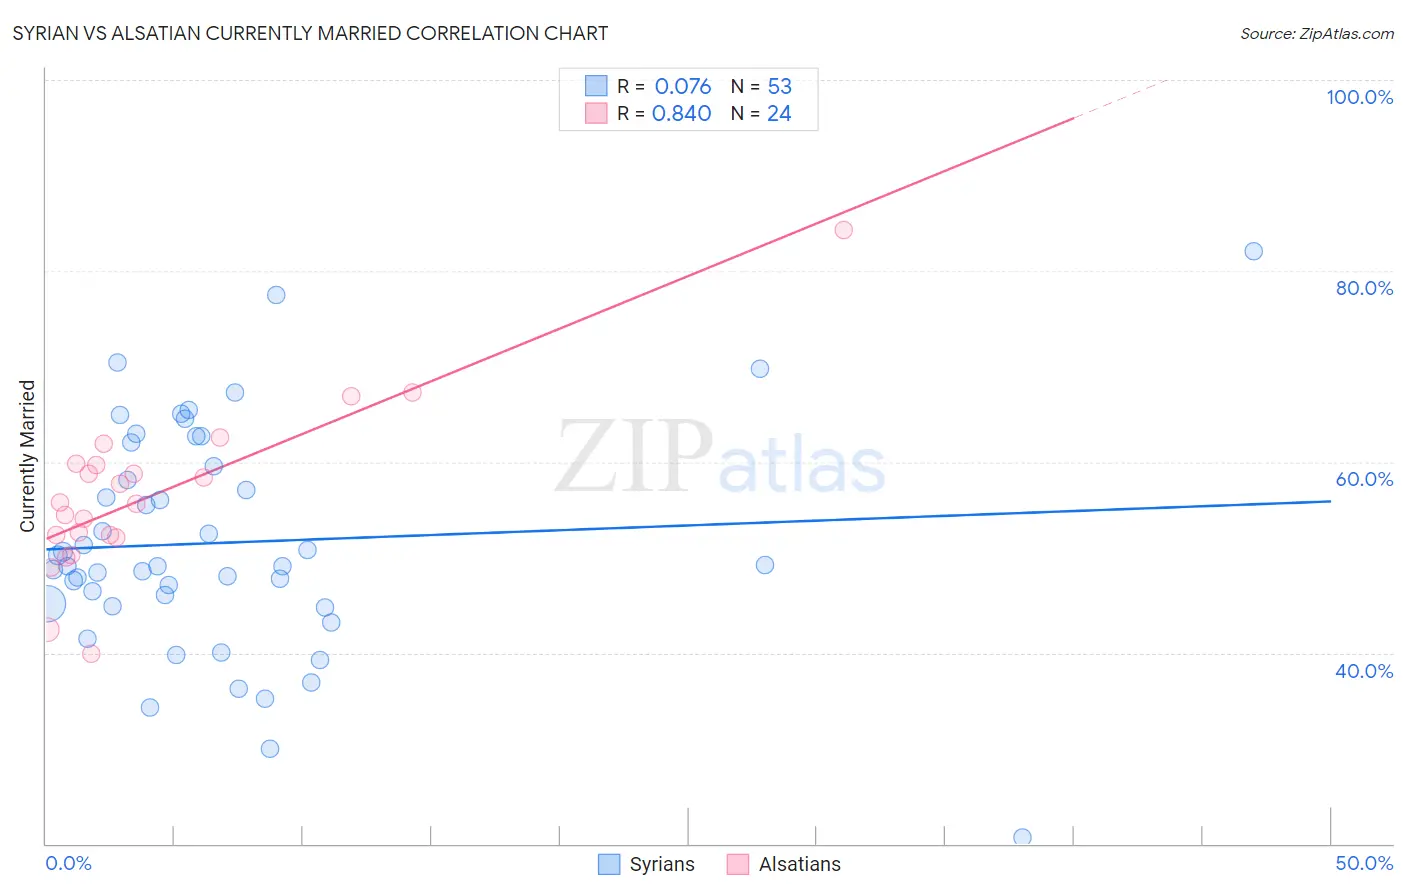
Syrian vs Alsatian Currently Married Correlation Chart
The statistical analysis conducted on geographies consisting of 266,298,061 people shows a slight positive correlation between the proportion of Syrians and percentage of population currently married in the United States with a correlation coefficient (R) of 0.076 and weighted average of 47.5%. Similarly, the statistical analysis conducted on geographies consisting of 82,681,658 people shows a very strong positive correlation between the proportion of Alsatians and percentage of population currently married in the United States with a correlation coefficient (R) of 0.840 and weighted average of 45.7%, a difference of 3.9%.
Currently Married Correlation Summary
| Measurement | Syrian | Alsatian |
| Minimum | 20.6% | 39.9% |
| Maximum | 82.1% | 84.3% |
| Range | 61.5% | 44.4% |
| Mean | 51.6% | 56.5% |
| Median | 49.1% | 55.7% |
| Interquartile 25% (IQ1) | 45.0% | 52.2% |
| Interquartile 75% (IQ3) | 60.8% | 59.7% |
| Interquartile Range (IQR) | 15.7% | 7.5% |
| Standard Deviation (Sample) | 11.8% | 8.8% |
| Standard Deviation (Population) | 11.7% | 8.6% |
Similar Demographics by Currently Married
Demographics Similar to Syrians by Currently Married
In terms of currently married, the demographic groups most similar to Syrians are Immigrants from Croatia (47.5%, a difference of 0.030%), Osage (47.5%, a difference of 0.090%), Immigrants from Philippines (47.6%, a difference of 0.12%), Australian (47.6%, a difference of 0.12%), and Puget Sound Salish (47.6%, a difference of 0.13%).
| Demographics | Rating | Rank | Currently Married |
| Immigrants | Denmark | 90.9 /100 | #113 | Exceptional 47.6% |
| South Africans | 90.5 /100 | #114 | Exceptional 47.6% |
| Immigrants | Indonesia | 90.5 /100 | #115 | Exceptional 47.6% |
| Palestinians | 90.4 /100 | #116 | Exceptional 47.6% |
| Puget Sound Salish | 90.3 /100 | #117 | Exceptional 47.6% |
| Immigrants | Philippines | 90.2 /100 | #118 | Exceptional 47.6% |
| Australians | 90.2 /100 | #119 | Exceptional 47.6% |
| Syrians | 88.9 /100 | #120 | Excellent 47.5% |
| Immigrants | Croatia | 88.6 /100 | #121 | Excellent 47.5% |
| Osage | 87.9 /100 | #122 | Excellent 47.5% |
| Immigrants | Kazakhstan | 87.2 /100 | #123 | Excellent 47.4% |
| Laotians | 86.6 /100 | #124 | Excellent 47.4% |
| Okinawans | 85.3 /100 | #125 | Excellent 47.4% |
| Immigrants | Jordan | 84.9 /100 | #126 | Excellent 47.4% |
| New Zealanders | 84.9 /100 | #127 | Excellent 47.4% |
Demographics Similar to Alsatians by Currently Married
In terms of currently married, the demographic groups most similar to Alsatians are Immigrants from South America (45.7%, a difference of 0.010%), Immigrants (45.8%, a difference of 0.050%), South American Indian (45.8%, a difference of 0.070%), Immigrants from Spain (45.8%, a difference of 0.080%), and Taiwanese (45.8%, a difference of 0.090%).
| Demographics | Rating | Rank | Currently Married |
| Malaysians | 15.3 /100 | #201 | Poor 45.9% |
| Immigrants | Albania | 14.5 /100 | #202 | Poor 45.9% |
| Taiwanese | 11.7 /100 | #203 | Poor 45.8% |
| Immigrants | Spain | 11.6 /100 | #204 | Poor 45.8% |
| South American Indians | 11.5 /100 | #205 | Poor 45.8% |
| Immigrants | Immigrants | 11.2 /100 | #206 | Poor 45.8% |
| Immigrants | South America | 10.8 /100 | #207 | Poor 45.7% |
| Alsatians | 10.8 /100 | #208 | Poor 45.7% |
| Immigrants | Micronesia | 8.8 /100 | #209 | Tragic 45.6% |
| Uruguayans | 7.9 /100 | #210 | Tragic 45.6% |
| Houma | 7.2 /100 | #211 | Tragic 45.5% |
| Marshallese | 7.2 /100 | #212 | Tragic 45.5% |
| Alaska Natives | 7.0 /100 | #213 | Tragic 45.5% |
| Dutch West Indians | 6.7 /100 | #214 | Tragic 45.5% |
| German Russians | 6.7 /100 | #215 | Tragic 45.5% |