Immigrants from Belize vs Dominican Single Father Households
COMPARE
Immigrants from Belize
Dominican
Single Father Households
Single Father Households Comparison
Immigrants from Belize
Dominicans
2.5%
SINGLE FATHER HOUSEHOLDS
0.9/ 100
METRIC RATING
261st/ 347
METRIC RANK
2.5%
SINGLE FATHER HOUSEHOLDS
0.8/ 100
METRIC RATING
263rd/ 347
METRIC RANK
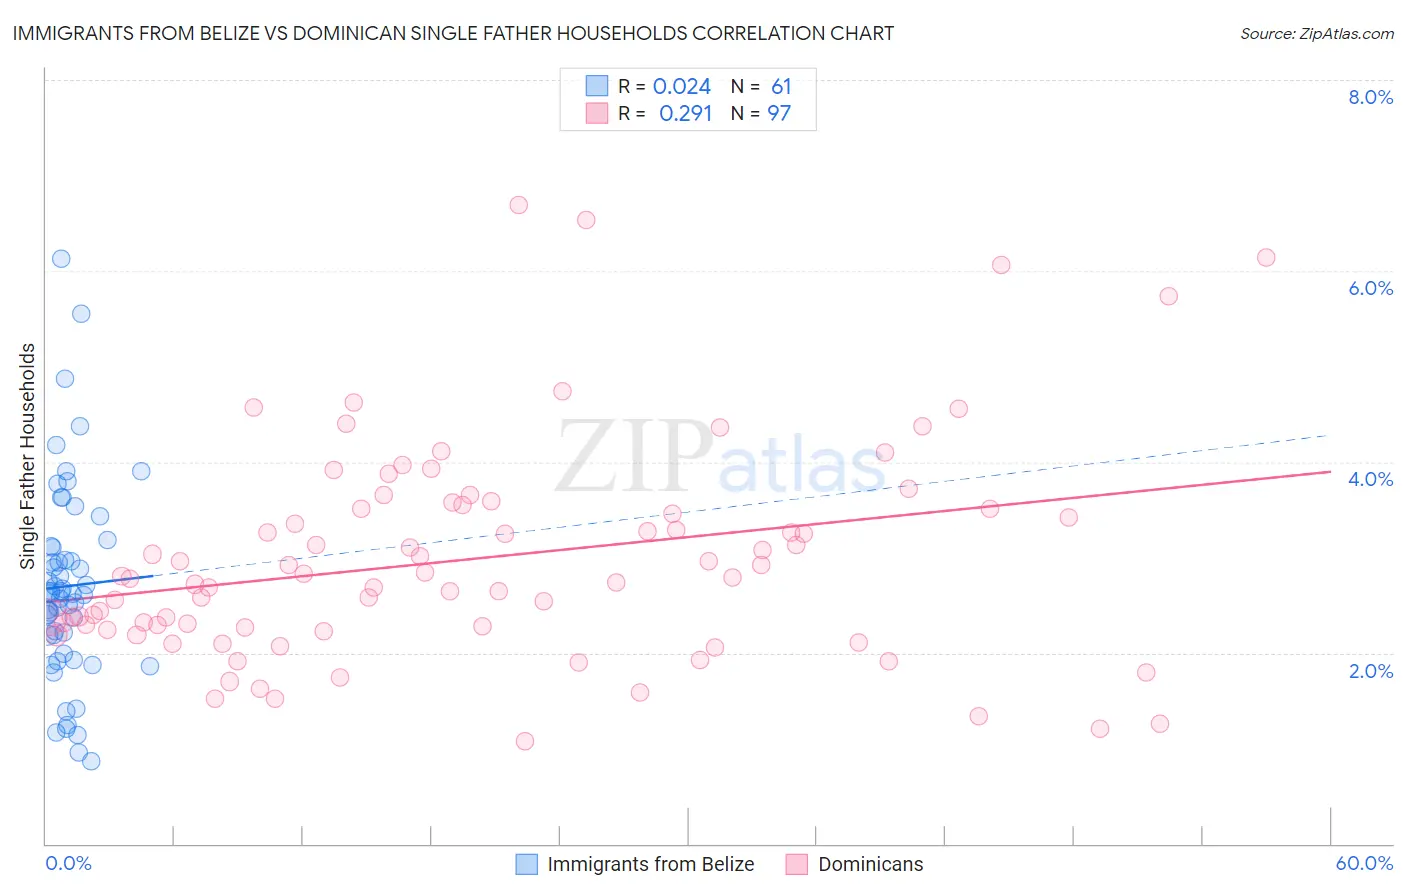
Immigrants from Belize vs Dominican Single Father Households Correlation Chart
The statistical analysis conducted on geographies consisting of 129,846,095 people shows no correlation between the proportion of Immigrants from Belize and percentage of single father households in the United States with a correlation coefficient (R) of 0.024 and weighted average of 2.5%. Similarly, the statistical analysis conducted on geographies consisting of 351,968,082 people shows a weak positive correlation between the proportion of Dominicans and percentage of single father households in the United States with a correlation coefficient (R) of 0.291 and weighted average of 2.5%, a difference of 0.28%.
Single Father Households Correlation Summary
| Measurement | Immigrants from Belize | Dominican |
| Minimum | 0.87% | 1.1% |
| Maximum | 6.1% | 6.7% |
| Range | 5.3% | 5.6% |
| Mean | 2.7% | 3.0% |
| Median | 2.6% | 2.8% |
| Interquartile 25% (IQ1) | 2.1% | 2.3% |
| Interquartile 75% (IQ3) | 3.1% | 3.5% |
| Interquartile Range (IQR) | 1.0% | 1.3% |
| Standard Deviation (Sample) | 1.0% | 1.1% |
| Standard Deviation (Population) | 1.0% | 1.1% |
Demographics Similar to Immigrants from Belize and Dominicans by Single Father Households
In terms of single father households, the demographic groups most similar to Immigrants from Belize are Immigrants from Liberia (2.5%, a difference of 0.15%), Immigrants from Caribbean (2.5%, a difference of 0.16%), Comanche (2.5%, a difference of 0.25%), Spanish (2.5%, a difference of 0.40%), and Immigrants from Congo (2.5%, a difference of 0.49%). Similarly, the demographic groups most similar to Dominicans are Immigrants from Liberia (2.5%, a difference of 0.13%), Immigrants from Caribbean (2.5%, a difference of 0.44%), Comanche (2.5%, a difference of 0.53%), Spanish (2.5%, a difference of 0.68%), and Indonesian (2.6%, a difference of 0.69%).
| Demographics | Rating | Rank | Single Father Households |
| Immigrants | Eritrea | 2.0 /100 | #252 | Tragic 2.5% |
| Immigrants | Somalia | 1.9 /100 | #253 | Tragic 2.5% |
| Immigrants | Thailand | 1.8 /100 | #254 | Tragic 2.5% |
| Tongans | 1.5 /100 | #255 | Tragic 2.5% |
| Potawatomi | 1.4 /100 | #256 | Tragic 2.5% |
| Immigrants | Congo | 1.2 /100 | #257 | Tragic 2.5% |
| Spanish | 1.1 /100 | #258 | Tragic 2.5% |
| Comanche | 1.0 /100 | #259 | Tragic 2.5% |
| Immigrants | Caribbean | 1.0 /100 | #260 | Tragic 2.5% |
| Immigrants | Belize | 0.9 /100 | #261 | Tragic 2.5% |
| Immigrants | Liberia | 0.8 /100 | #262 | Tragic 2.5% |
| Dominicans | 0.8 /100 | #263 | Tragic 2.5% |
| Indonesians | 0.5 /100 | #264 | Tragic 2.6% |
| Immigrants | Micronesia | 0.5 /100 | #265 | Tragic 2.6% |
| French American Indians | 0.5 /100 | #266 | Tragic 2.6% |
| Guamanians/Chamorros | 0.4 /100 | #267 | Tragic 2.6% |
| Haitians | 0.4 /100 | #268 | Tragic 2.6% |
| Cubans | 0.3 /100 | #269 | Tragic 2.6% |
| Seminole | 0.3 /100 | #270 | Tragic 2.6% |
| Creek | 0.2 /100 | #271 | Tragic 2.6% |
| Belizeans | 0.2 /100 | #272 | Tragic 2.6% |