U.S. Virgin Islander vs Assyrian/Chaldean/Syriac Births to Unmarried Women
COMPARE
U.S. Virgin Islander
Assyrian/Chaldean/Syriac
Births to Unmarried Women
Births to Unmarried Women Comparison
U.S. Virgin Islanders
Assyrians/Chaldeans/Syriacs
39.6%
BIRTHS TO UNMARRIED WOMEN
0.0/ 100
METRIC RATING
312th/ 347
METRIC RANK
22.0%
BIRTHS TO UNMARRIED WOMEN
100.0/ 100
METRIC RATING
1st/ 347
METRIC RANK
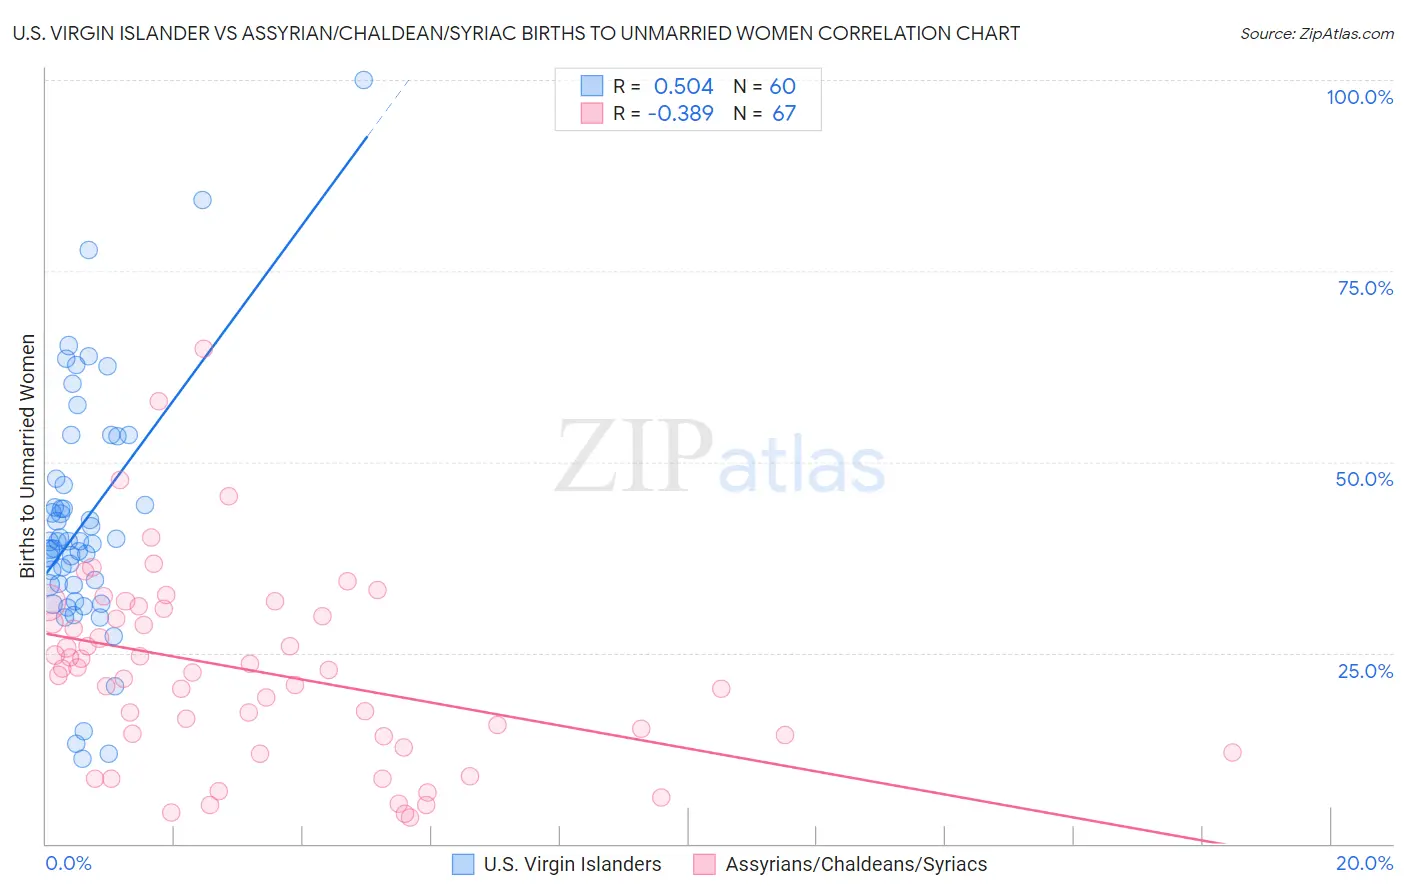
U.S. Virgin Islander vs Assyrian/Chaldean/Syriac Births to Unmarried Women Correlation Chart
The statistical analysis conducted on geographies consisting of 86,503,849 people shows a substantial positive correlation between the proportion of U.S. Virgin Islanders and percentage of births to unmarried women in the United States with a correlation coefficient (R) of 0.504 and weighted average of 39.6%. Similarly, the statistical analysis conducted on geographies consisting of 106,724,446 people shows a mild negative correlation between the proportion of Assyrians/Chaldeans/Syriacs and percentage of births to unmarried women in the United States with a correlation coefficient (R) of -0.389 and weighted average of 22.0%, a difference of 80.1%.
Births to Unmarried Women Correlation Summary
| Measurement | U.S. Virgin Islander | Assyrian/Chaldean/Syriac |
| Minimum | 11.2% | 3.5% |
| Maximum | 100.0% | 64.8% |
| Range | 88.8% | 61.3% |
| Mean | 42.2% | 22.7% |
| Median | 39.6% | 22.7% |
| Interquartile 25% (IQ1) | 33.9% | 14.0% |
| Interquartile 75% (IQ3) | 47.4% | 30.8% |
| Interquartile Range (IQR) | 13.5% | 16.8% |
| Standard Deviation (Sample) | 16.2% | 12.6% |
| Standard Deviation (Population) | 16.1% | 12.5% |
Similar Demographics by Births to Unmarried Women
Demographics Similar to U.S. Virgin Islanders by Births to Unmarried Women
In terms of births to unmarried women, the demographic groups most similar to U.S. Virgin Islanders are Immigrants from the Azores (39.6%, a difference of 0.020%), Immigrants from Dominica (39.5%, a difference of 0.25%), African (39.7%, a difference of 0.34%), Cuban (39.4%, a difference of 0.48%), and Aleut (39.3%, a difference of 0.60%).
| Demographics | Rating | Rank | Births to Unmarried Women |
| Immigrants | Haiti | 0.0 /100 | #305 | Tragic 38.9% |
| Central American Indians | 0.0 /100 | #306 | Tragic 39.0% |
| Immigrants | Honduras | 0.0 /100 | #307 | Tragic 39.3% |
| Aleuts | 0.0 /100 | #308 | Tragic 39.3% |
| Cubans | 0.0 /100 | #309 | Tragic 39.4% |
| Immigrants | Dominica | 0.0 /100 | #310 | Tragic 39.5% |
| Immigrants | Azores | 0.0 /100 | #311 | Tragic 39.6% |
| U.S. Virgin Islanders | 0.0 /100 | #312 | Tragic 39.6% |
| Africans | 0.0 /100 | #313 | Tragic 39.7% |
| Immigrants | Caribbean | 0.0 /100 | #314 | Tragic 39.8% |
| Dominicans | 0.0 /100 | #315 | Tragic 39.8% |
| Apache | 0.0 /100 | #316 | Tragic 39.9% |
| Immigrants | Dominican Republic | 0.0 /100 | #317 | Tragic 40.1% |
| Immigrants | Bahamas | 0.0 /100 | #318 | Tragic 40.1% |
| Yakama | 0.0 /100 | #319 | Tragic 40.3% |
Demographics Similar to Assyrians/Chaldeans/Syriacs by Births to Unmarried Women
In terms of births to unmarried women, the demographic groups most similar to Assyrians/Chaldeans/Syriacs are Immigrants from India (22.9%, a difference of 4.2%), Filipino (23.0%, a difference of 4.6%), Immigrants from Taiwan (23.0%, a difference of 4.7%), Immigrants from Hong Kong (23.6%, a difference of 7.3%), and Immigrants from Iran (24.0%, a difference of 9.0%).
| Demographics | Rating | Rank | Births to Unmarried Women |
| Assyrians/Chaldeans/Syriacs | 100.0 /100 | #1 | Exceptional 22.0% |
| Immigrants | India | 100.0 /100 | #2 | Exceptional 22.9% |
| Filipinos | 100.0 /100 | #3 | Exceptional 23.0% |
| Immigrants | Taiwan | 100.0 /100 | #4 | Exceptional 23.0% |
| Immigrants | Hong Kong | 100.0 /100 | #5 | Exceptional 23.6% |
| Immigrants | Iran | 100.0 /100 | #6 | Exceptional 24.0% |
| Thais | 100.0 /100 | #7 | Exceptional 24.0% |
| Immigrants | China | 100.0 /100 | #8 | Exceptional 24.7% |
| Immigrants | South Central Asia | 100.0 /100 | #9 | Exceptional 24.7% |
| Immigrants | Eastern Asia | 100.0 /100 | #10 | Exceptional 25.0% |
| Immigrants | Israel | 100.0 /100 | #11 | Exceptional 25.1% |
| Indians (Asian) | 100.0 /100 | #12 | Exceptional 25.3% |
| Iranians | 100.0 /100 | #13 | Exceptional 25.3% |
| Immigrants | Lebanon | 100.0 /100 | #14 | Exceptional 25.3% |
| Immigrants | Singapore | 100.0 /100 | #15 | Exceptional 25.6% |