U.S. Virgin Islander vs Immigrants from Pakistan Births to Unmarried Women
COMPARE
U.S. Virgin Islander
Immigrants from Pakistan
Births to Unmarried Women
Births to Unmarried Women Comparison
U.S. Virgin Islanders
Immigrants from Pakistan
39.6%
BIRTHS TO UNMARRIED WOMEN
0.0/ 100
METRIC RATING
312th/ 347
METRIC RANK
27.2%
BIRTHS TO UNMARRIED WOMEN
99.8/ 100
METRIC RATING
34th/ 347
METRIC RANK
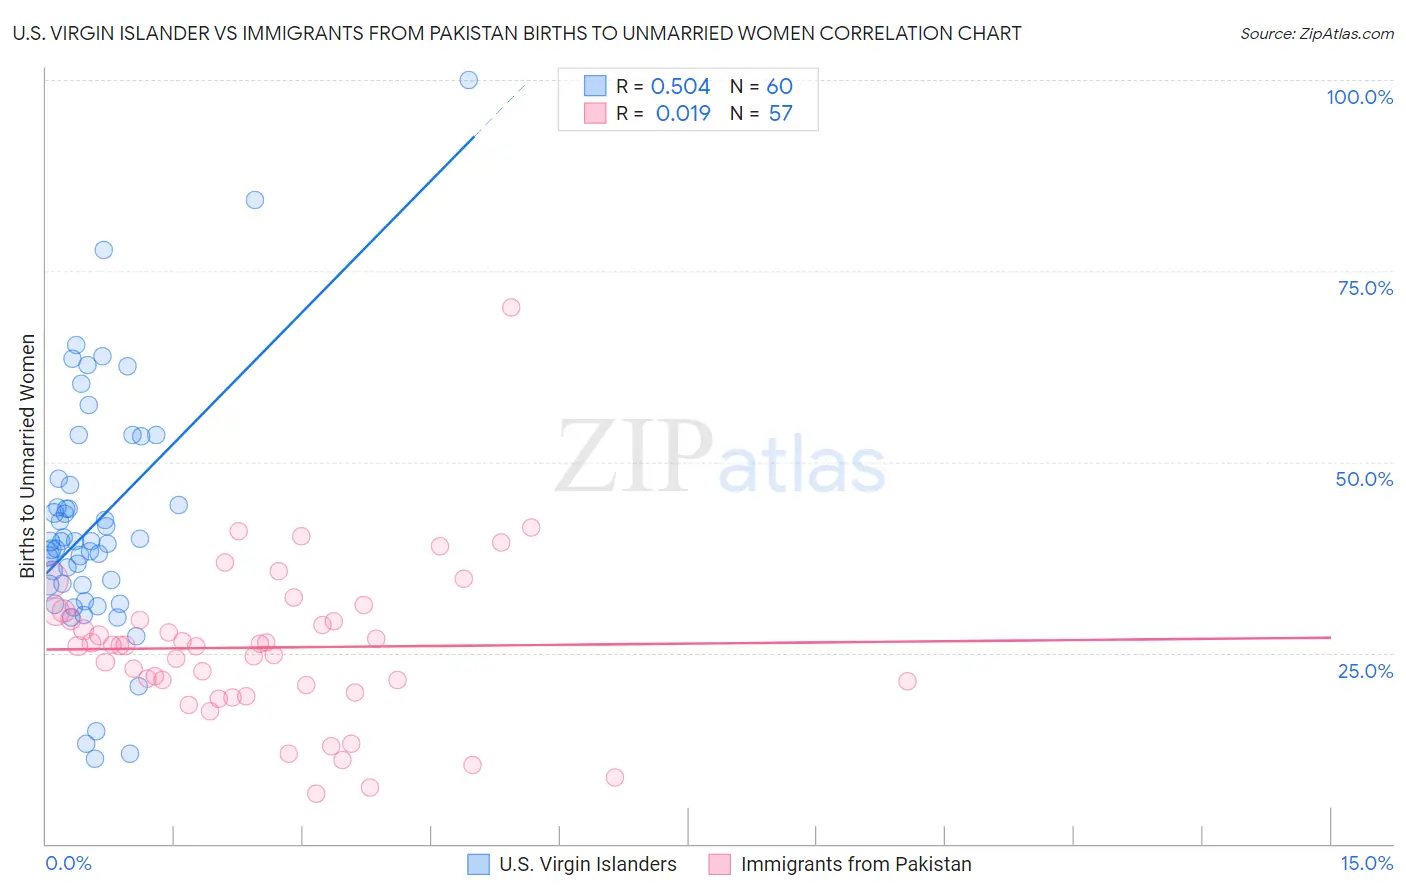
U.S. Virgin Islander vs Immigrants from Pakistan Births to Unmarried Women Correlation Chart
The statistical analysis conducted on geographies consisting of 86,503,849 people shows a substantial positive correlation between the proportion of U.S. Virgin Islanders and percentage of births to unmarried women in the United States with a correlation coefficient (R) of 0.504 and weighted average of 39.6%. Similarly, the statistical analysis conducted on geographies consisting of 268,631,463 people shows no correlation between the proportion of Immigrants from Pakistan and percentage of births to unmarried women in the United States with a correlation coefficient (R) of 0.019 and weighted average of 27.2%, a difference of 45.6%.
Births to Unmarried Women Correlation Summary
| Measurement | U.S. Virgin Islander | Immigrants from Pakistan |
| Minimum | 11.2% | 6.6% |
| Maximum | 100.0% | 70.2% |
| Range | 88.8% | 63.6% |
| Mean | 42.2% | 25.7% |
| Median | 39.6% | 26.0% |
| Interquartile 25% (IQ1) | 33.9% | 20.3% |
| Interquartile 75% (IQ3) | 47.4% | 29.9% |
| Interquartile Range (IQR) | 13.5% | 9.6% |
| Standard Deviation (Sample) | 16.2% | 10.3% |
| Standard Deviation (Population) | 16.1% | 10.3% |
Similar Demographics by Births to Unmarried Women
Demographics Similar to U.S. Virgin Islanders by Births to Unmarried Women
In terms of births to unmarried women, the demographic groups most similar to U.S. Virgin Islanders are Immigrants from the Azores (39.6%, a difference of 0.020%), Immigrants from Dominica (39.5%, a difference of 0.25%), African (39.7%, a difference of 0.34%), Cuban (39.4%, a difference of 0.48%), and Aleut (39.3%, a difference of 0.60%).
| Demographics | Rating | Rank | Births to Unmarried Women |
| Immigrants | Haiti | 0.0 /100 | #305 | Tragic 38.9% |
| Central American Indians | 0.0 /100 | #306 | Tragic 39.0% |
| Immigrants | Honduras | 0.0 /100 | #307 | Tragic 39.3% |
| Aleuts | 0.0 /100 | #308 | Tragic 39.3% |
| Cubans | 0.0 /100 | #309 | Tragic 39.4% |
| Immigrants | Dominica | 0.0 /100 | #310 | Tragic 39.5% |
| Immigrants | Azores | 0.0 /100 | #311 | Tragic 39.6% |
| U.S. Virgin Islanders | 0.0 /100 | #312 | Tragic 39.6% |
| Africans | 0.0 /100 | #313 | Tragic 39.7% |
| Immigrants | Caribbean | 0.0 /100 | #314 | Tragic 39.8% |
| Dominicans | 0.0 /100 | #315 | Tragic 39.8% |
| Apache | 0.0 /100 | #316 | Tragic 39.9% |
| Immigrants | Dominican Republic | 0.0 /100 | #317 | Tragic 40.1% |
| Immigrants | Bahamas | 0.0 /100 | #318 | Tragic 40.1% |
| Yakama | 0.0 /100 | #319 | Tragic 40.3% |
Demographics Similar to Immigrants from Pakistan by Births to Unmarried Women
In terms of births to unmarried women, the demographic groups most similar to Immigrants from Pakistan are Immigrants from Sri Lanka (27.2%, a difference of 0.040%), Immigrants from Ireland (27.2%, a difference of 0.070%), Immigrants from Russia (27.1%, a difference of 0.11%), Immigrants from Iraq (27.1%, a difference of 0.14%), and Immigrants from Western Asia (27.2%, a difference of 0.15%).
| Demographics | Rating | Rank | Births to Unmarried Women |
| Immigrants | Asia | 99.9 /100 | #27 | Exceptional 26.8% |
| Okinawans | 99.8 /100 | #28 | Exceptional 26.9% |
| Cypriots | 99.8 /100 | #29 | Exceptional 27.0% |
| Bulgarians | 99.8 /100 | #30 | Exceptional 27.1% |
| Immigrants | Iraq | 99.8 /100 | #31 | Exceptional 27.1% |
| Immigrants | Russia | 99.8 /100 | #32 | Exceptional 27.1% |
| Immigrants | Sri Lanka | 99.8 /100 | #33 | Exceptional 27.2% |
| Immigrants | Pakistan | 99.8 /100 | #34 | Exceptional 27.2% |
| Immigrants | Ireland | 99.7 /100 | #35 | Exceptional 27.2% |
| Immigrants | Western Asia | 99.7 /100 | #36 | Exceptional 27.2% |
| Immigrants | Ukraine | 99.7 /100 | #37 | Exceptional 27.2% |
| Immigrants | Moldova | 99.7 /100 | #38 | Exceptional 27.3% |
| Immigrants | Malaysia | 99.7 /100 | #39 | Exceptional 27.4% |
| Turks | 99.6 /100 | #40 | Exceptional 27.4% |
| Iraqis | 99.6 /100 | #41 | Exceptional 27.6% |