U.S. Virgin Islander vs Assyrian/Chaldean/Syriac Unemployment Among Youth under 25 years
COMPARE
U.S. Virgin Islander
Assyrian/Chaldean/Syriac
Unemployment Among Youth under 25 years
Unemployment Among Youth under 25 years Comparison
U.S. Virgin Islanders
Assyrians/Chaldeans/Syriacs
13.6%
UNEMPLOYMENT AMONG YOUTH UNDER 25 YEARS
0.0/ 100
METRIC RATING
297th/ 347
METRIC RANK
11.9%
UNEMPLOYMENT AMONG YOUTH UNDER 25 YEARS
9.8/ 100
METRIC RATING
210th/ 347
METRIC RANK
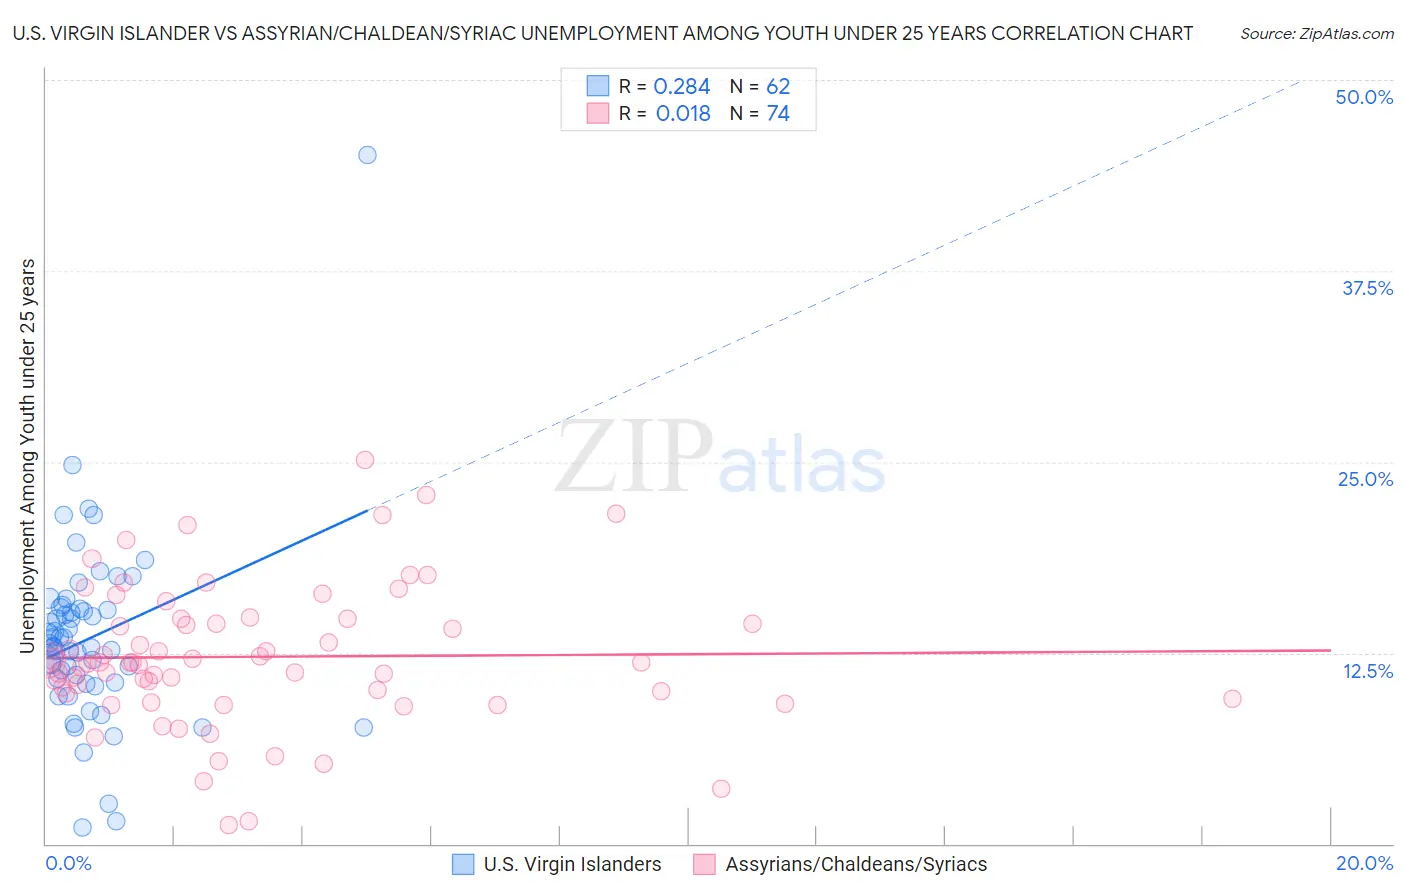
U.S. Virgin Islander vs Assyrian/Chaldean/Syriac Unemployment Among Youth under 25 years Correlation Chart
The statistical analysis conducted on geographies consisting of 87,396,014 people shows a weak positive correlation between the proportion of U.S. Virgin Islanders and unemployment rate among youth under the age of 25 in the United States with a correlation coefficient (R) of 0.284 and weighted average of 13.6%. Similarly, the statistical analysis conducted on geographies consisting of 109,923,358 people shows no correlation between the proportion of Assyrians/Chaldeans/Syriacs and unemployment rate among youth under the age of 25 in the United States with a correlation coefficient (R) of 0.018 and weighted average of 11.9%, a difference of 14.7%.
Unemployment Among Youth under 25 years Correlation Summary
| Measurement | U.S. Virgin Islander | Assyrian/Chaldean/Syriac |
| Minimum | 1.1% | 1.2% |
| Maximum | 45.1% | 25.1% |
| Range | 44.0% | 23.9% |
| Mean | 13.5% | 12.2% |
| Median | 13.0% | 11.9% |
| Interquartile 25% (IQ1) | 10.6% | 9.8% |
| Interquartile 75% (IQ3) | 15.4% | 14.7% |
| Interquartile Range (IQR) | 4.8% | 4.9% |
| Standard Deviation (Sample) | 6.1% | 4.6% |
| Standard Deviation (Population) | 6.1% | 4.6% |
Similar Demographics by Unemployment Among Youth under 25 years
Demographics Similar to U.S. Virgin Islanders by Unemployment Among Youth under 25 years
In terms of unemployment among youth under 25 years, the demographic groups most similar to U.S. Virgin Islanders are Senegalese (13.5%, a difference of 0.62%), Chippewa (13.5%, a difference of 0.65%), Shoshone (13.7%, a difference of 0.86%), Immigrants from Caribbean (13.5%, a difference of 0.88%), and Spanish American Indian (13.5%, a difference of 1.1%).
| Demographics | Rating | Rank | Unemployment Among Youth under 25 years |
| Immigrants | Ecuador | 0.0 /100 | #290 | Tragic 13.4% |
| Apache | 0.0 /100 | #291 | Tragic 13.5% |
| Central American Indians | 0.0 /100 | #292 | Tragic 13.5% |
| Spanish American Indians | 0.0 /100 | #293 | Tragic 13.5% |
| Immigrants | Caribbean | 0.0 /100 | #294 | Tragic 13.5% |
| Chippewa | 0.0 /100 | #295 | Tragic 13.5% |
| Senegalese | 0.0 /100 | #296 | Tragic 13.5% |
| U.S. Virgin Islanders | 0.0 /100 | #297 | Tragic 13.6% |
| Shoshone | 0.0 /100 | #298 | Tragic 13.7% |
| Tohono O'odham | 0.0 /100 | #299 | Tragic 13.8% |
| Immigrants | Cabo Verde | 0.0 /100 | #300 | Tragic 13.8% |
| Immigrants | Senegal | 0.0 /100 | #301 | Tragic 13.8% |
| Immigrants | Sierra Leone | 0.0 /100 | #302 | Tragic 13.8% |
| Belizeans | 0.0 /100 | #303 | Tragic 13.8% |
| Houma | 0.0 /100 | #304 | Tragic 13.8% |
Demographics Similar to Assyrians/Chaldeans/Syriacs by Unemployment Among Youth under 25 years
In terms of unemployment among youth under 25 years, the demographic groups most similar to Assyrians/Chaldeans/Syriacs are Immigrants from Philippines (11.9%, a difference of 0.070%), Colombian (11.9%, a difference of 0.090%), Immigrants from Lebanon (11.8%, a difference of 0.15%), South American (11.9%, a difference of 0.16%), and Costa Rican (11.9%, a difference of 0.21%).
| Demographics | Rating | Rank | Unemployment Among Youth under 25 years |
| Immigrants | Peru | 15.3 /100 | #203 | Poor 11.8% |
| Immigrants | Costa Rica | 15.2 /100 | #204 | Poor 11.8% |
| Peruvians | 14.0 /100 | #205 | Poor 11.8% |
| Immigrants | Pakistan | 12.6 /100 | #206 | Poor 11.8% |
| Immigrants | Southern Europe | 12.3 /100 | #207 | Poor 11.8% |
| Comanche | 12.1 /100 | #208 | Poor 11.8% |
| Immigrants | Lebanon | 11.3 /100 | #209 | Poor 11.8% |
| Assyrians/Chaldeans/Syriacs | 9.8 /100 | #210 | Tragic 11.9% |
| Immigrants | Philippines | 9.2 /100 | #211 | Tragic 11.9% |
| Colombians | 9.1 /100 | #212 | Tragic 11.9% |
| South Americans | 8.5 /100 | #213 | Tragic 11.9% |
| Costa Ricans | 8.2 /100 | #214 | Tragic 11.9% |
| Samoans | 7.4 /100 | #215 | Tragic 11.9% |
| Guamanians/Chamorros | 7.0 /100 | #216 | Tragic 11.9% |
| Yaqui | 6.9 /100 | #217 | Tragic 11.9% |