U.S. Virgin Islander vs Immigrants from the Azores Births to Unmarried Women
COMPARE
U.S. Virgin Islander
Immigrants from the Azores
Births to Unmarried Women
Births to Unmarried Women Comparison
U.S. Virgin Islanders
Immigrants from the Azores
39.6%
BIRTHS TO UNMARRIED WOMEN
0.0/ 100
METRIC RATING
312th/ 347
METRIC RANK
39.6%
BIRTHS TO UNMARRIED WOMEN
0.0/ 100
METRIC RATING
311th/ 347
METRIC RANK
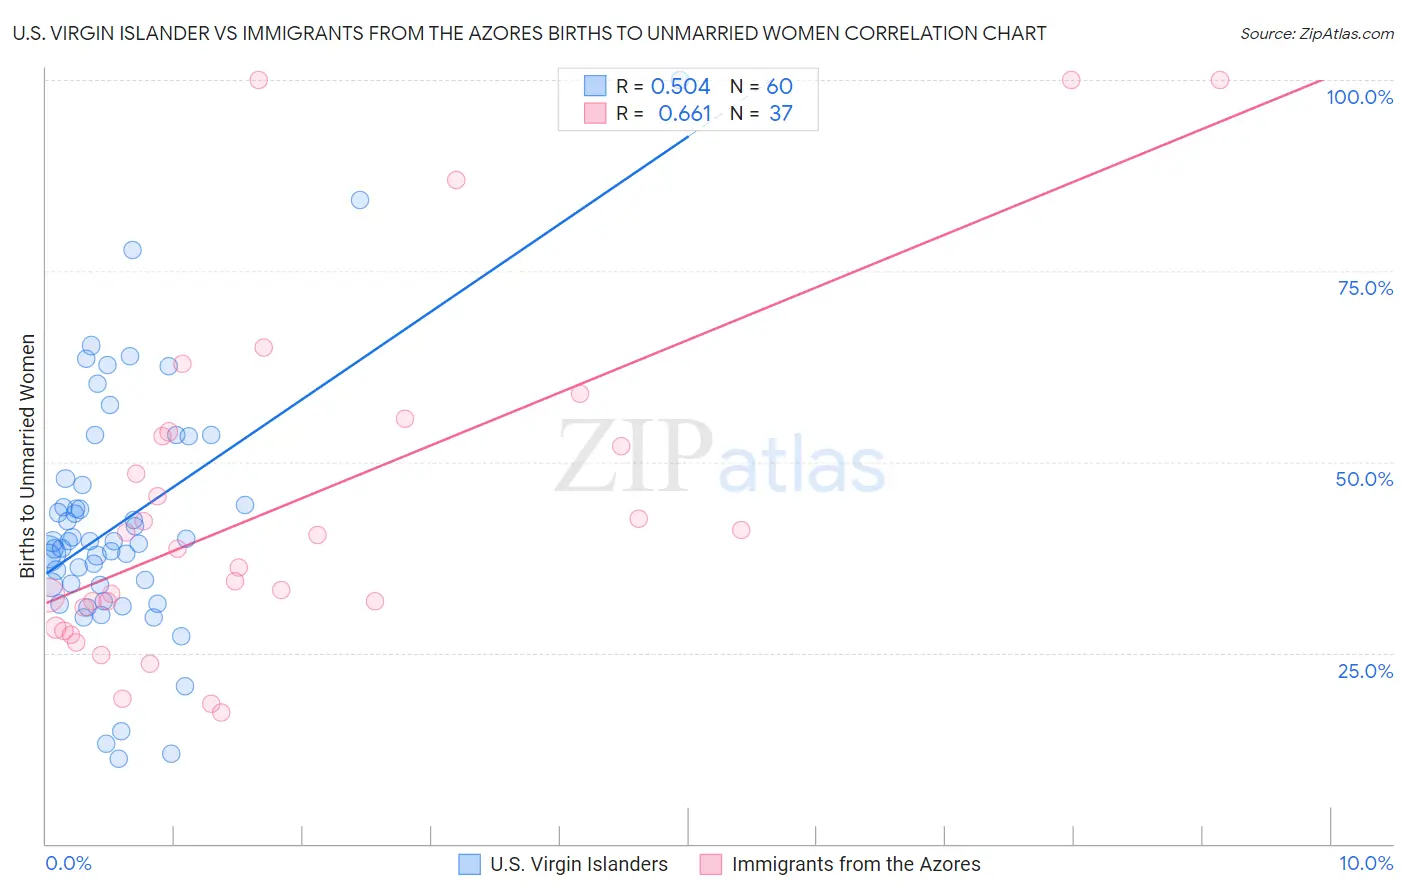
U.S. Virgin Islander vs Immigrants from the Azores Births to Unmarried Women Correlation Chart
The statistical analysis conducted on geographies consisting of 86,503,849 people shows a substantial positive correlation between the proportion of U.S. Virgin Islanders and percentage of births to unmarried women in the United States with a correlation coefficient (R) of 0.504 and weighted average of 39.6%. Similarly, the statistical analysis conducted on geographies consisting of 45,022,253 people shows a significant positive correlation between the proportion of Immigrants from the Azores and percentage of births to unmarried women in the United States with a correlation coefficient (R) of 0.661 and weighted average of 39.6%, a difference of 0.020%.
Births to Unmarried Women Correlation Summary
| Measurement | U.S. Virgin Islander | Immigrants from the Azores |
| Minimum | 11.2% | 17.2% |
| Maximum | 100.0% | 100.0% |
| Range | 88.8% | 82.8% |
| Mean | 42.2% | 44.2% |
| Median | 39.6% | 38.6% |
| Interquartile 25% (IQ1) | 33.9% | 29.6% |
| Interquartile 75% (IQ3) | 47.4% | 53.6% |
| Interquartile Range (IQR) | 13.5% | 24.0% |
| Standard Deviation (Sample) | 16.2% | 22.2% |
| Standard Deviation (Population) | 16.1% | 21.9% |
Demographics Similar to U.S. Virgin Islanders and Immigrants from the Azores by Births to Unmarried Women
In terms of births to unmarried women, the demographic groups most similar to U.S. Virgin Islanders are Immigrants from Dominica (39.5%, a difference of 0.25%), African (39.7%, a difference of 0.34%), Cuban (39.4%, a difference of 0.48%), Aleut (39.3%, a difference of 0.60%), and Immigrants from Caribbean (39.8%, a difference of 0.63%). Similarly, the demographic groups most similar to Immigrants from the Azores are Immigrants from Dominica (39.5%, a difference of 0.23%), African (39.7%, a difference of 0.36%), Cuban (39.4%, a difference of 0.46%), Aleut (39.3%, a difference of 0.58%), and Immigrants from Caribbean (39.8%, a difference of 0.65%).
| Demographics | Rating | Rank | Births to Unmarried Women |
| Haitians | 0.0 /100 | #301 | Tragic 38.6% |
| Hondurans | 0.0 /100 | #302 | Tragic 38.7% |
| Immigrants | Jamaica | 0.0 /100 | #303 | Tragic 38.8% |
| Yaqui | 0.0 /100 | #304 | Tragic 38.8% |
| Immigrants | Haiti | 0.0 /100 | #305 | Tragic 38.9% |
| Central American Indians | 0.0 /100 | #306 | Tragic 39.0% |
| Immigrants | Honduras | 0.0 /100 | #307 | Tragic 39.3% |
| Aleuts | 0.0 /100 | #308 | Tragic 39.3% |
| Cubans | 0.0 /100 | #309 | Tragic 39.4% |
| Immigrants | Dominica | 0.0 /100 | #310 | Tragic 39.5% |
| Immigrants | Azores | 0.0 /100 | #311 | Tragic 39.6% |
| U.S. Virgin Islanders | 0.0 /100 | #312 | Tragic 39.6% |
| Africans | 0.0 /100 | #313 | Tragic 39.7% |
| Immigrants | Caribbean | 0.0 /100 | #314 | Tragic 39.8% |
| Dominicans | 0.0 /100 | #315 | Tragic 39.8% |
| Apache | 0.0 /100 | #316 | Tragic 39.9% |
| Immigrants | Dominican Republic | 0.0 /100 | #317 | Tragic 40.1% |
| Immigrants | Bahamas | 0.0 /100 | #318 | Tragic 40.1% |
| Yakama | 0.0 /100 | #319 | Tragic 40.3% |
| Crow | 0.0 /100 | #320 | Tragic 40.4% |
| Bahamians | 0.0 /100 | #321 | Tragic 40.8% |