Ottawa vs Assyrian/Chaldean/Syriac Births to Unmarried Women
COMPARE
Ottawa
Assyrian/Chaldean/Syriac
Births to Unmarried Women
Births to Unmarried Women Comparison
Ottawa
Assyrians/Chaldeans/Syriacs
36.5%
BIRTHS TO UNMARRIED WOMEN
0.2/ 100
METRIC RATING
260th/ 347
METRIC RANK
22.0%
BIRTHS TO UNMARRIED WOMEN
100.0/ 100
METRIC RATING
1st/ 347
METRIC RANK
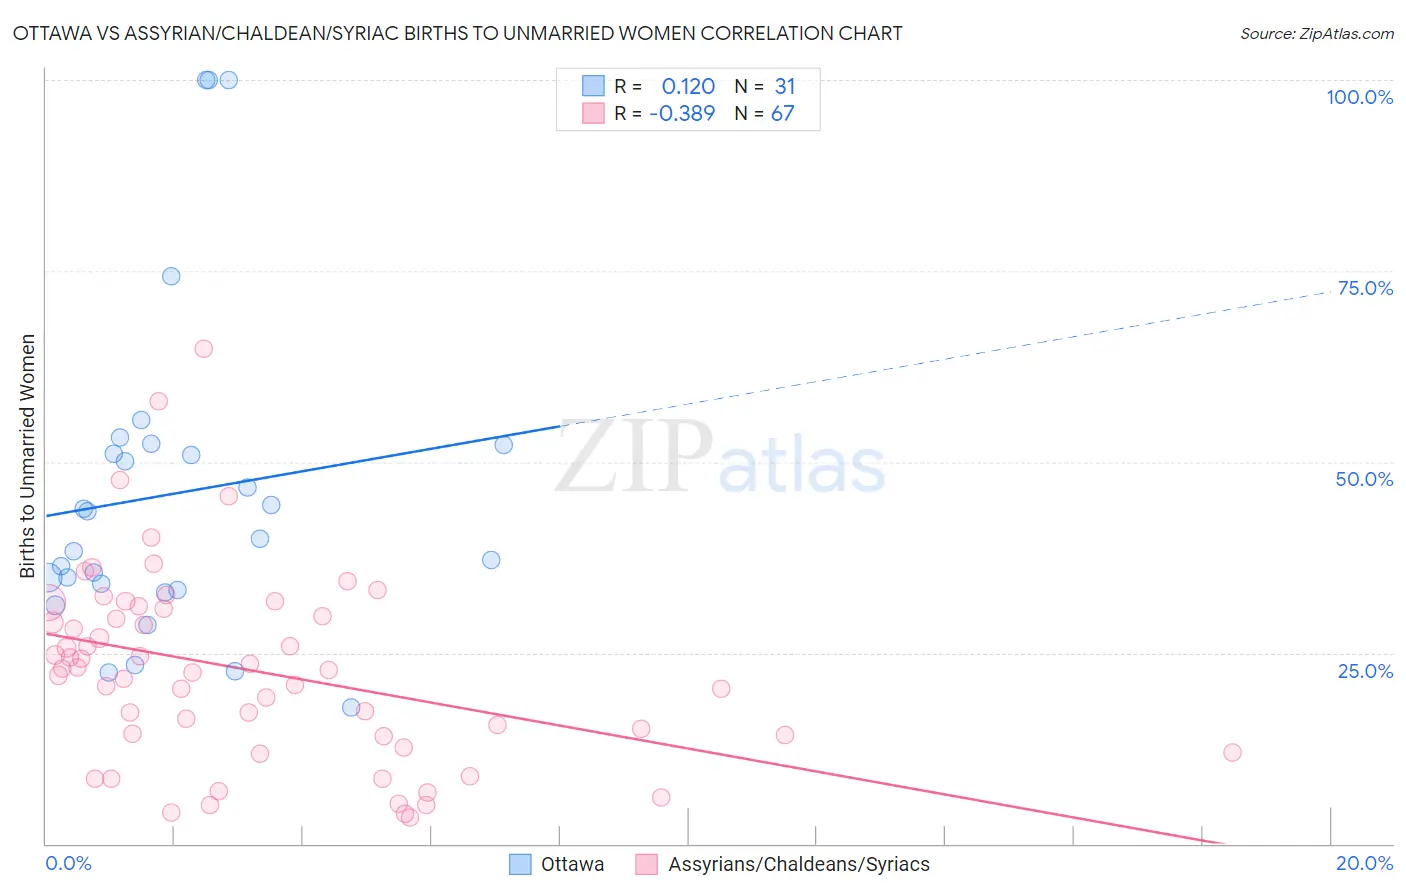
Ottawa vs Assyrian/Chaldean/Syriac Births to Unmarried Women Correlation Chart
The statistical analysis conducted on geographies consisting of 48,969,239 people shows a poor positive correlation between the proportion of Ottawa and percentage of births to unmarried women in the United States with a correlation coefficient (R) of 0.120 and weighted average of 36.5%. Similarly, the statistical analysis conducted on geographies consisting of 106,724,446 people shows a mild negative correlation between the proportion of Assyrians/Chaldeans/Syriacs and percentage of births to unmarried women in the United States with a correlation coefficient (R) of -0.389 and weighted average of 22.0%, a difference of 66.0%.
Births to Unmarried Women Correlation Summary
| Measurement | Ottawa | Assyrian/Chaldean/Syriac |
| Minimum | 17.9% | 3.5% |
| Maximum | 100.0% | 64.8% |
| Range | 82.1% | 61.3% |
| Mean | 45.9% | 22.7% |
| Median | 40.0% | 22.7% |
| Interquartile 25% (IQ1) | 33.3% | 14.0% |
| Interquartile 75% (IQ3) | 52.2% | 30.8% |
| Interquartile Range (IQR) | 18.9% | 16.8% |
| Standard Deviation (Sample) | 21.5% | 12.6% |
| Standard Deviation (Population) | 21.2% | 12.5% |
Similar Demographics by Births to Unmarried Women
Demographics Similar to Ottawa by Births to Unmarried Women
In terms of births to unmarried women, the demographic groups most similar to Ottawa are Trinidadian and Tobagonian (36.5%, a difference of 0.0%), Immigrants from El Salvador (36.4%, a difference of 0.12%), American (36.4%, a difference of 0.16%), French American Indian (36.6%, a difference of 0.37%), and Nicaraguan (36.6%, a difference of 0.39%).
| Demographics | Rating | Rank | Births to Unmarried Women |
| Immigrants | Portugal | 0.2 /100 | #253 | Tragic 36.2% |
| Potawatomi | 0.2 /100 | #254 | Tragic 36.2% |
| Chickasaw | 0.2 /100 | #255 | Tragic 36.3% |
| Immigrants | Trinidad and Tobago | 0.2 /100 | #256 | Tragic 36.3% |
| Immigrants | Grenada | 0.2 /100 | #257 | Tragic 36.3% |
| Americans | 0.2 /100 | #258 | Tragic 36.4% |
| Immigrants | El Salvador | 0.2 /100 | #259 | Tragic 36.4% |
| Ottawa | 0.2 /100 | #260 | Tragic 36.5% |
| Trinidadians and Tobagonians | 0.2 /100 | #261 | Tragic 36.5% |
| French American Indians | 0.1 /100 | #262 | Tragic 36.6% |
| Nicaraguans | 0.1 /100 | #263 | Tragic 36.6% |
| Sub-Saharan Africans | 0.1 /100 | #264 | Tragic 36.7% |
| Cherokee | 0.1 /100 | #265 | Tragic 36.7% |
| Immigrants | Senegal | 0.1 /100 | #266 | Tragic 36.7% |
| Central Americans | 0.1 /100 | #267 | Tragic 36.7% |
Demographics Similar to Assyrians/Chaldeans/Syriacs by Births to Unmarried Women
In terms of births to unmarried women, the demographic groups most similar to Assyrians/Chaldeans/Syriacs are Immigrants from India (22.9%, a difference of 4.2%), Filipino (23.0%, a difference of 4.6%), Immigrants from Taiwan (23.0%, a difference of 4.7%), Immigrants from Hong Kong (23.6%, a difference of 7.3%), and Immigrants from Iran (24.0%, a difference of 9.0%).
| Demographics | Rating | Rank | Births to Unmarried Women |
| Assyrians/Chaldeans/Syriacs | 100.0 /100 | #1 | Exceptional 22.0% |
| Immigrants | India | 100.0 /100 | #2 | Exceptional 22.9% |
| Filipinos | 100.0 /100 | #3 | Exceptional 23.0% |
| Immigrants | Taiwan | 100.0 /100 | #4 | Exceptional 23.0% |
| Immigrants | Hong Kong | 100.0 /100 | #5 | Exceptional 23.6% |
| Immigrants | Iran | 100.0 /100 | #6 | Exceptional 24.0% |
| Thais | 100.0 /100 | #7 | Exceptional 24.0% |
| Immigrants | China | 100.0 /100 | #8 | Exceptional 24.7% |
| Immigrants | South Central Asia | 100.0 /100 | #9 | Exceptional 24.7% |
| Immigrants | Eastern Asia | 100.0 /100 | #10 | Exceptional 25.0% |
| Immigrants | Israel | 100.0 /100 | #11 | Exceptional 25.1% |
| Indians (Asian) | 100.0 /100 | #12 | Exceptional 25.3% |
| Iranians | 100.0 /100 | #13 | Exceptional 25.3% |
| Immigrants | Lebanon | 100.0 /100 | #14 | Exceptional 25.3% |
| Immigrants | Singapore | 100.0 /100 | #15 | Exceptional 25.6% |