U.S. Virgin Islander vs Canadian Births to Unmarried Women
COMPARE
U.S. Virgin Islander
Canadian
Births to Unmarried Women
Births to Unmarried Women Comparison
U.S. Virgin Islanders
Canadians
39.6%
BIRTHS TO UNMARRIED WOMEN
0.0/ 100
METRIC RATING
312th/ 347
METRIC RANK
31.9%
BIRTHS TO UNMARRIED WOMEN
41.4/ 100
METRIC RATING
183rd/ 347
METRIC RANK
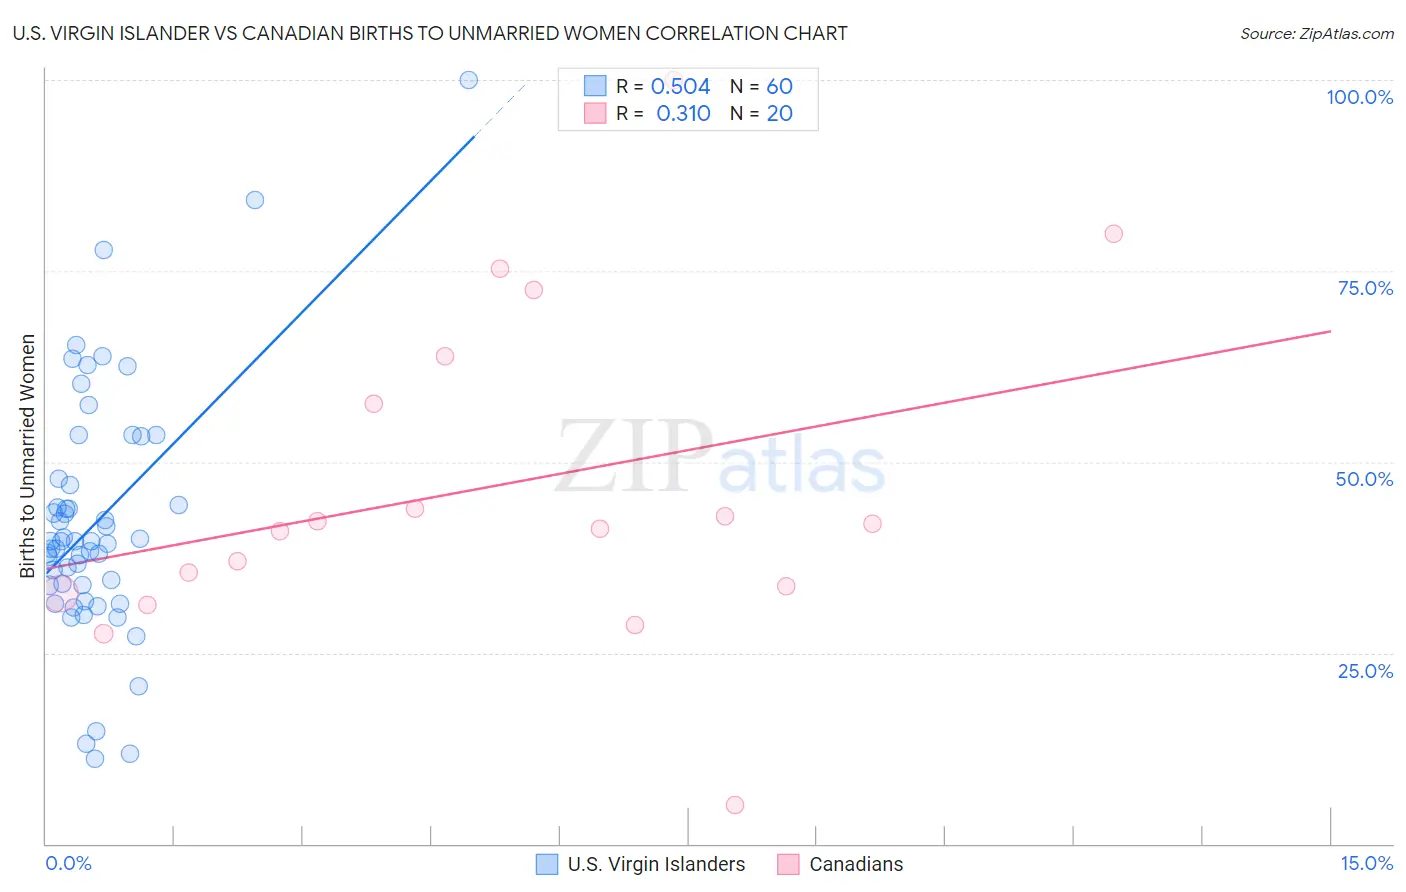
U.S. Virgin Islander vs Canadian Births to Unmarried Women Correlation Chart
The statistical analysis conducted on geographies consisting of 86,503,849 people shows a substantial positive correlation between the proportion of U.S. Virgin Islanders and percentage of births to unmarried women in the United States with a correlation coefficient (R) of 0.504 and weighted average of 39.6%. Similarly, the statistical analysis conducted on geographies consisting of 401,938,228 people shows a mild positive correlation between the proportion of Canadians and percentage of births to unmarried women in the United States with a correlation coefficient (R) of 0.310 and weighted average of 31.9%, a difference of 23.9%.
Births to Unmarried Women Correlation Summary
| Measurement | U.S. Virgin Islander | Canadian |
| Minimum | 11.2% | 5.0% |
| Maximum | 100.0% | 100.0% |
| Range | 88.8% | 95.0% |
| Mean | 42.2% | 46.7% |
| Median | 39.6% | 41.6% |
| Interquartile 25% (IQ1) | 33.9% | 33.2% |
| Interquartile 75% (IQ3) | 47.4% | 60.7% |
| Interquartile Range (IQR) | 13.5% | 27.6% |
| Standard Deviation (Sample) | 16.2% | 22.0% |
| Standard Deviation (Population) | 16.1% | 21.5% |
Similar Demographics by Births to Unmarried Women
Demographics Similar to U.S. Virgin Islanders by Births to Unmarried Women
In terms of births to unmarried women, the demographic groups most similar to U.S. Virgin Islanders are Immigrants from the Azores (39.6%, a difference of 0.020%), Immigrants from Dominica (39.5%, a difference of 0.25%), African (39.7%, a difference of 0.34%), Cuban (39.4%, a difference of 0.48%), and Aleut (39.3%, a difference of 0.60%).
| Demographics | Rating | Rank | Births to Unmarried Women |
| Immigrants | Haiti | 0.0 /100 | #305 | Tragic 38.9% |
| Central American Indians | 0.0 /100 | #306 | Tragic 39.0% |
| Immigrants | Honduras | 0.0 /100 | #307 | Tragic 39.3% |
| Aleuts | 0.0 /100 | #308 | Tragic 39.3% |
| Cubans | 0.0 /100 | #309 | Tragic 39.4% |
| Immigrants | Dominica | 0.0 /100 | #310 | Tragic 39.5% |
| Immigrants | Azores | 0.0 /100 | #311 | Tragic 39.6% |
| U.S. Virgin Islanders | 0.0 /100 | #312 | Tragic 39.6% |
| Africans | 0.0 /100 | #313 | Tragic 39.7% |
| Immigrants | Caribbean | 0.0 /100 | #314 | Tragic 39.8% |
| Dominicans | 0.0 /100 | #315 | Tragic 39.8% |
| Apache | 0.0 /100 | #316 | Tragic 39.9% |
| Immigrants | Dominican Republic | 0.0 /100 | #317 | Tragic 40.1% |
| Immigrants | Bahamas | 0.0 /100 | #318 | Tragic 40.1% |
| Yakama | 0.0 /100 | #319 | Tragic 40.3% |
Demographics Similar to Canadians by Births to Unmarried Women
In terms of births to unmarried women, the demographic groups most similar to Canadians are Immigrants from South America (32.0%, a difference of 0.070%), Kenyan (31.9%, a difference of 0.16%), German (32.0%, a difference of 0.18%), Welsh (32.0%, a difference of 0.31%), and Czechoslovakian (32.0%, a difference of 0.33%).
| Demographics | Rating | Rank | Births to Unmarried Women |
| Scottish | 48.1 /100 | #176 | Average 31.7% |
| South American Indians | 47.7 /100 | #177 | Average 31.7% |
| English | 47.4 /100 | #178 | Average 31.7% |
| South Americans | 46.9 /100 | #179 | Average 31.8% |
| Moroccans | 45.7 /100 | #180 | Average 31.8% |
| Immigrants | Peru | 45.1 /100 | #181 | Average 31.8% |
| Kenyans | 43.0 /100 | #182 | Average 31.9% |
| Canadians | 41.4 /100 | #183 | Average 31.9% |
| Immigrants | South America | 40.7 /100 | #184 | Average 32.0% |
| Germans | 39.5 /100 | #185 | Fair 32.0% |
| Welsh | 38.2 /100 | #186 | Fair 32.0% |
| Czechoslovakians | 38.0 /100 | #187 | Fair 32.0% |
| Osage | 37.1 /100 | #188 | Fair 32.1% |
| Immigrants | Kenya | 36.9 /100 | #189 | Fair 32.1% |
| Tlingit-Haida | 32.6 /100 | #190 | Fair 32.2% |