U.S. Virgin Islander vs Immigrants from North America Births to Unmarried Women
COMPARE
U.S. Virgin Islander
Immigrants from North America
Births to Unmarried Women
Births to Unmarried Women Comparison
U.S. Virgin Islanders
Immigrants from North America
39.6%
BIRTHS TO UNMARRIED WOMEN
0.0/ 100
METRIC RATING
312th/ 347
METRIC RANK
30.6%
BIRTHS TO UNMARRIED WOMEN
81.5/ 100
METRIC RATING
145th/ 347
METRIC RANK
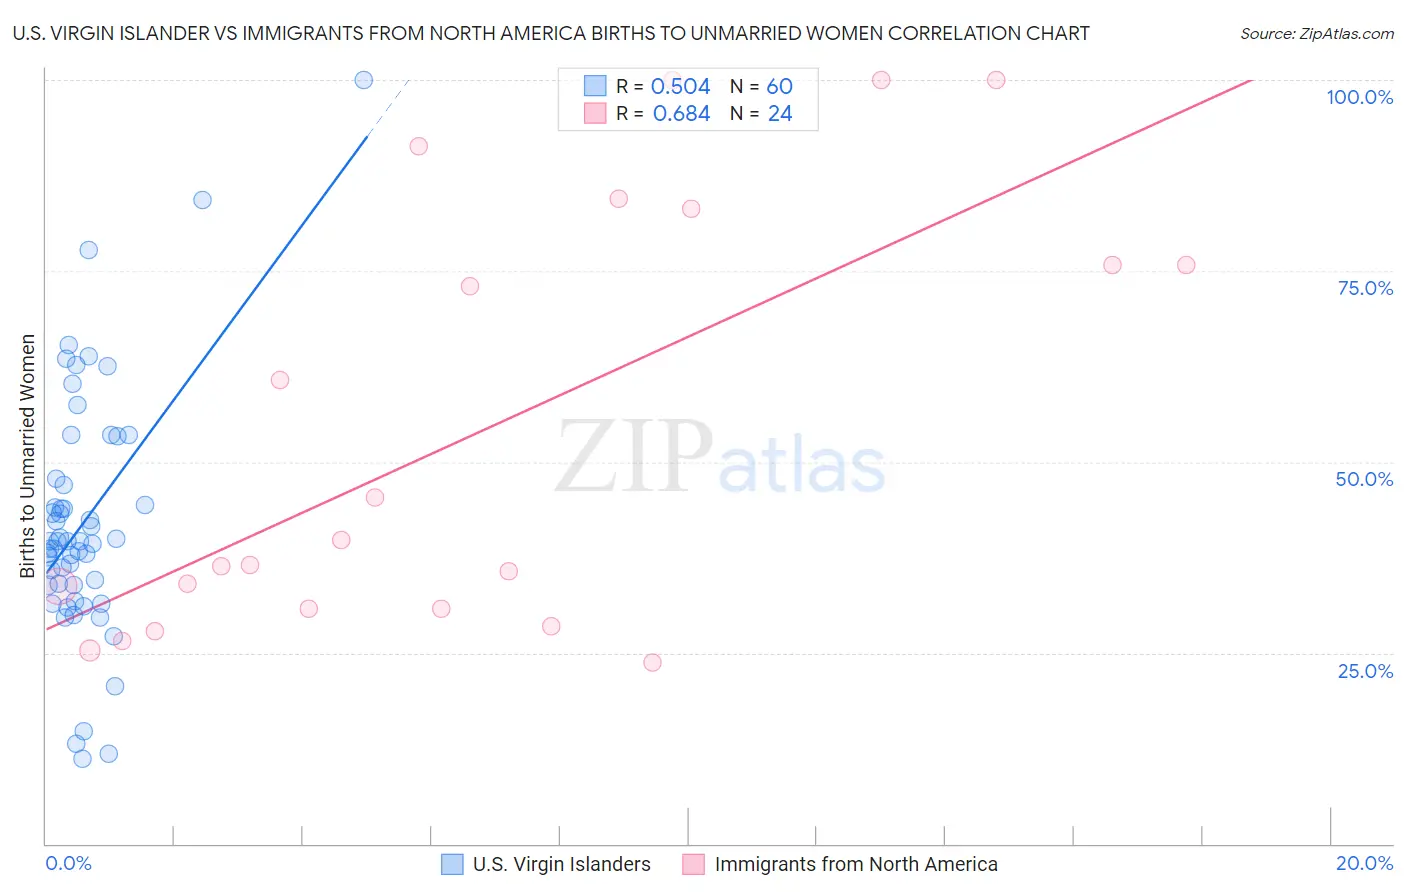
U.S. Virgin Islander vs Immigrants from North America Births to Unmarried Women Correlation Chart
The statistical analysis conducted on geographies consisting of 86,503,849 people shows a substantial positive correlation between the proportion of U.S. Virgin Islanders and percentage of births to unmarried women in the United States with a correlation coefficient (R) of 0.504 and weighted average of 39.6%. Similarly, the statistical analysis conducted on geographies consisting of 422,623,655 people shows a significant positive correlation between the proportion of Immigrants from North America and percentage of births to unmarried women in the United States with a correlation coefficient (R) of 0.684 and weighted average of 30.6%, a difference of 29.5%.
Births to Unmarried Women Correlation Summary
| Measurement | U.S. Virgin Islander | Immigrants from North America |
| Minimum | 11.2% | 23.8% |
| Maximum | 100.0% | 100.0% |
| Range | 88.8% | 76.2% |
| Mean | 42.2% | 54.1% |
| Median | 39.6% | 38.1% |
| Interquartile 25% (IQ1) | 33.9% | 30.8% |
| Interquartile 75% (IQ3) | 47.4% | 79.4% |
| Interquartile Range (IQR) | 13.5% | 48.7% |
| Standard Deviation (Sample) | 16.2% | 27.8% |
| Standard Deviation (Population) | 16.1% | 27.2% |
Similar Demographics by Births to Unmarried Women
Demographics Similar to U.S. Virgin Islanders by Births to Unmarried Women
In terms of births to unmarried women, the demographic groups most similar to U.S. Virgin Islanders are Immigrants from the Azores (39.6%, a difference of 0.020%), Immigrants from Dominica (39.5%, a difference of 0.25%), African (39.7%, a difference of 0.34%), Cuban (39.4%, a difference of 0.48%), and Aleut (39.3%, a difference of 0.60%).
| Demographics | Rating | Rank | Births to Unmarried Women |
| Immigrants | Haiti | 0.0 /100 | #305 | Tragic 38.9% |
| Central American Indians | 0.0 /100 | #306 | Tragic 39.0% |
| Immigrants | Honduras | 0.0 /100 | #307 | Tragic 39.3% |
| Aleuts | 0.0 /100 | #308 | Tragic 39.3% |
| Cubans | 0.0 /100 | #309 | Tragic 39.4% |
| Immigrants | Dominica | 0.0 /100 | #310 | Tragic 39.5% |
| Immigrants | Azores | 0.0 /100 | #311 | Tragic 39.6% |
| U.S. Virgin Islanders | 0.0 /100 | #312 | Tragic 39.6% |
| Africans | 0.0 /100 | #313 | Tragic 39.7% |
| Immigrants | Caribbean | 0.0 /100 | #314 | Tragic 39.8% |
| Dominicans | 0.0 /100 | #315 | Tragic 39.8% |
| Apache | 0.0 /100 | #316 | Tragic 39.9% |
| Immigrants | Dominican Republic | 0.0 /100 | #317 | Tragic 40.1% |
| Immigrants | Bahamas | 0.0 /100 | #318 | Tragic 40.1% |
| Yakama | 0.0 /100 | #319 | Tragic 40.3% |
Demographics Similar to Immigrants from North America by Births to Unmarried Women
In terms of births to unmarried women, the demographic groups most similar to Immigrants from North America are Northern European (30.6%, a difference of 0.030%), Immigrants from Oceania (30.6%, a difference of 0.050%), Czech (30.5%, a difference of 0.10%), Immigrants from Uganda (30.5%, a difference of 0.17%), and South African (30.5%, a difference of 0.19%).
| Demographics | Rating | Rank | Births to Unmarried Women |
| Puget Sound Salish | 83.9 /100 | #138 | Excellent 30.4% |
| Immigrants | Canada | 83.7 /100 | #139 | Excellent 30.4% |
| Swiss | 83.1 /100 | #140 | Excellent 30.5% |
| Pakistanis | 83.0 /100 | #141 | Excellent 30.5% |
| South Africans | 82.7 /100 | #142 | Excellent 30.5% |
| Immigrants | Uganda | 82.6 /100 | #143 | Excellent 30.5% |
| Czechs | 82.1 /100 | #144 | Excellent 30.5% |
| Immigrants | North America | 81.5 /100 | #145 | Excellent 30.6% |
| Northern Europeans | 81.4 /100 | #146 | Excellent 30.6% |
| Immigrants | Oceania | 81.2 /100 | #147 | Excellent 30.6% |
| Chileans | 79.1 /100 | #148 | Good 30.7% |
| Serbians | 78.8 /100 | #149 | Good 30.7% |
| Somalis | 77.8 /100 | #150 | Good 30.7% |
| Italians | 77.0 /100 | #151 | Good 30.8% |
| Poles | 76.2 /100 | #152 | Good 30.8% |