Ute vs Immigrants from Switzerland Currently Married
COMPARE
Ute
Immigrants from Switzerland
Currently Married
Currently Married Comparison
Ute
Immigrants from Switzerland
43.9%
CURRENTLY MARRIED
0.2/ 100
METRIC RATING
258th/ 347
METRIC RANK
46.9%
CURRENTLY MARRIED
67.8/ 100
METRIC RATING
157th/ 347
METRIC RANK
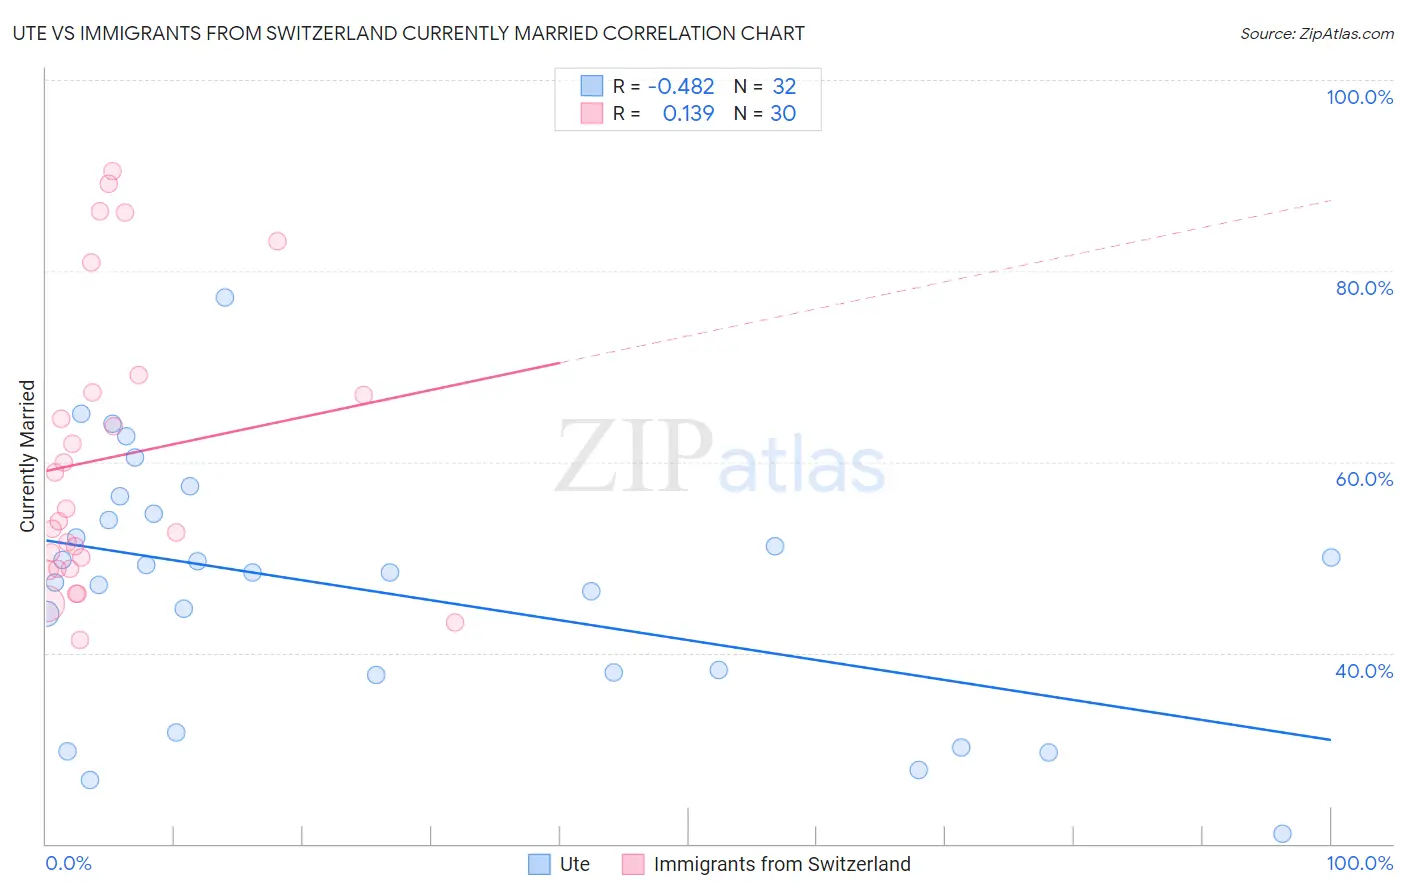
Ute vs Immigrants from Switzerland Currently Married Correlation Chart
The statistical analysis conducted on geographies consisting of 55,668,599 people shows a moderate negative correlation between the proportion of Ute and percentage of population currently married in the United States with a correlation coefficient (R) of -0.482 and weighted average of 43.9%. Similarly, the statistical analysis conducted on geographies consisting of 148,074,779 people shows a poor positive correlation between the proportion of Immigrants from Switzerland and percentage of population currently married in the United States with a correlation coefficient (R) of 0.139 and weighted average of 46.9%, a difference of 7.0%.
Currently Married Correlation Summary
| Measurement | Ute | Immigrants from Switzerland |
| Minimum | 21.0% | 41.3% |
| Maximum | 77.2% | 90.4% |
| Range | 56.2% | 49.1% |
| Mean | 46.6% | 60.5% |
| Median | 48.4% | 54.4% |
| Interquartile 25% (IQ1) | 37.9% | 48.8% |
| Interquartile 75% (IQ3) | 54.2% | 67.3% |
| Interquartile Range (IQR) | 16.4% | 18.5% |
| Standard Deviation (Sample) | 12.9% | 14.9% |
| Standard Deviation (Population) | 12.7% | 14.7% |
Similar Demographics by Currently Married
Demographics Similar to Ute by Currently Married
In terms of currently married, the demographic groups most similar to Ute are Immigrants from Africa (43.9%, a difference of 0.010%), Shoshone (44.0%, a difference of 0.21%), Immigrants from Sierra Leone (43.8%, a difference of 0.21%), Yakama (44.0%, a difference of 0.26%), and Immigrants from Latin America (43.8%, a difference of 0.27%).
| Demographics | Rating | Rank | Currently Married |
| Blackfeet | 0.3 /100 | #251 | Tragic 44.2% |
| Hispanics or Latinos | 0.3 /100 | #252 | Tragic 44.1% |
| Immigrants | Central America | 0.3 /100 | #253 | Tragic 44.1% |
| Vietnamese | 0.2 /100 | #254 | Tragic 44.0% |
| Yakama | 0.2 /100 | #255 | Tragic 44.0% |
| Shoshone | 0.2 /100 | #256 | Tragic 44.0% |
| Immigrants | Africa | 0.2 /100 | #257 | Tragic 43.9% |
| Ute | 0.2 /100 | #258 | Tragic 43.9% |
| Immigrants | Sierra Leone | 0.1 /100 | #259 | Tragic 43.8% |
| Immigrants | Latin America | 0.1 /100 | #260 | Tragic 43.8% |
| Immigrants | Nicaragua | 0.1 /100 | #261 | Tragic 43.7% |
| Bangladeshis | 0.1 /100 | #262 | Tragic 43.7% |
| Immigrants | Cuba | 0.1 /100 | #263 | Tragic 43.7% |
| Sudanese | 0.1 /100 | #264 | Tragic 43.7% |
| Immigrants | Bangladesh | 0.1 /100 | #265 | Tragic 43.6% |
Demographics Similar to Immigrants from Switzerland by Currently Married
In terms of currently married, the demographic groups most similar to Immigrants from Switzerland are Spanish (47.0%, a difference of 0.010%), Immigrants from Venezuela (47.0%, a difference of 0.030%), Albanian (47.0%, a difference of 0.030%), Arab (47.0%, a difference of 0.030%), and Immigrants from Serbia (47.0%, a difference of 0.040%).
| Demographics | Rating | Rank | Currently Married |
| Immigrants | Turkey | 70.0 /100 | #150 | Good 47.0% |
| Chileans | 69.8 /100 | #151 | Good 47.0% |
| Immigrants | Serbia | 68.8 /100 | #152 | Good 47.0% |
| Immigrants | Venezuela | 68.6 /100 | #153 | Good 47.0% |
| Albanians | 68.6 /100 | #154 | Good 47.0% |
| Arabs | 68.6 /100 | #155 | Good 47.0% |
| Spanish | 68.1 /100 | #156 | Good 47.0% |
| Immigrants | Switzerland | 67.8 /100 | #157 | Good 46.9% |
| Cherokee | 66.8 /100 | #158 | Good 46.9% |
| Iraqis | 66.4 /100 | #159 | Good 46.9% |
| Immigrants | Uzbekistan | 66.0 /100 | #160 | Good 46.9% |
| Immigrants | Southern Europe | 65.9 /100 | #161 | Good 46.9% |
| Immigrants | Nonimmigrants | 65.4 /100 | #162 | Good 46.9% |
| Delaware | 64.7 /100 | #163 | Good 46.9% |
| Immigrants | Western Asia | 64.2 /100 | #164 | Good 46.9% |