Ukrainian vs Immigrants from Switzerland Currently Married
COMPARE
Ukrainian
Immigrants from Switzerland
Currently Married
Currently Married Comparison
Ukrainians
Immigrants from Switzerland
48.4%
CURRENTLY MARRIED
98.3/ 100
METRIC RATING
65th/ 347
METRIC RANK
46.9%
CURRENTLY MARRIED
67.8/ 100
METRIC RATING
157th/ 347
METRIC RANK
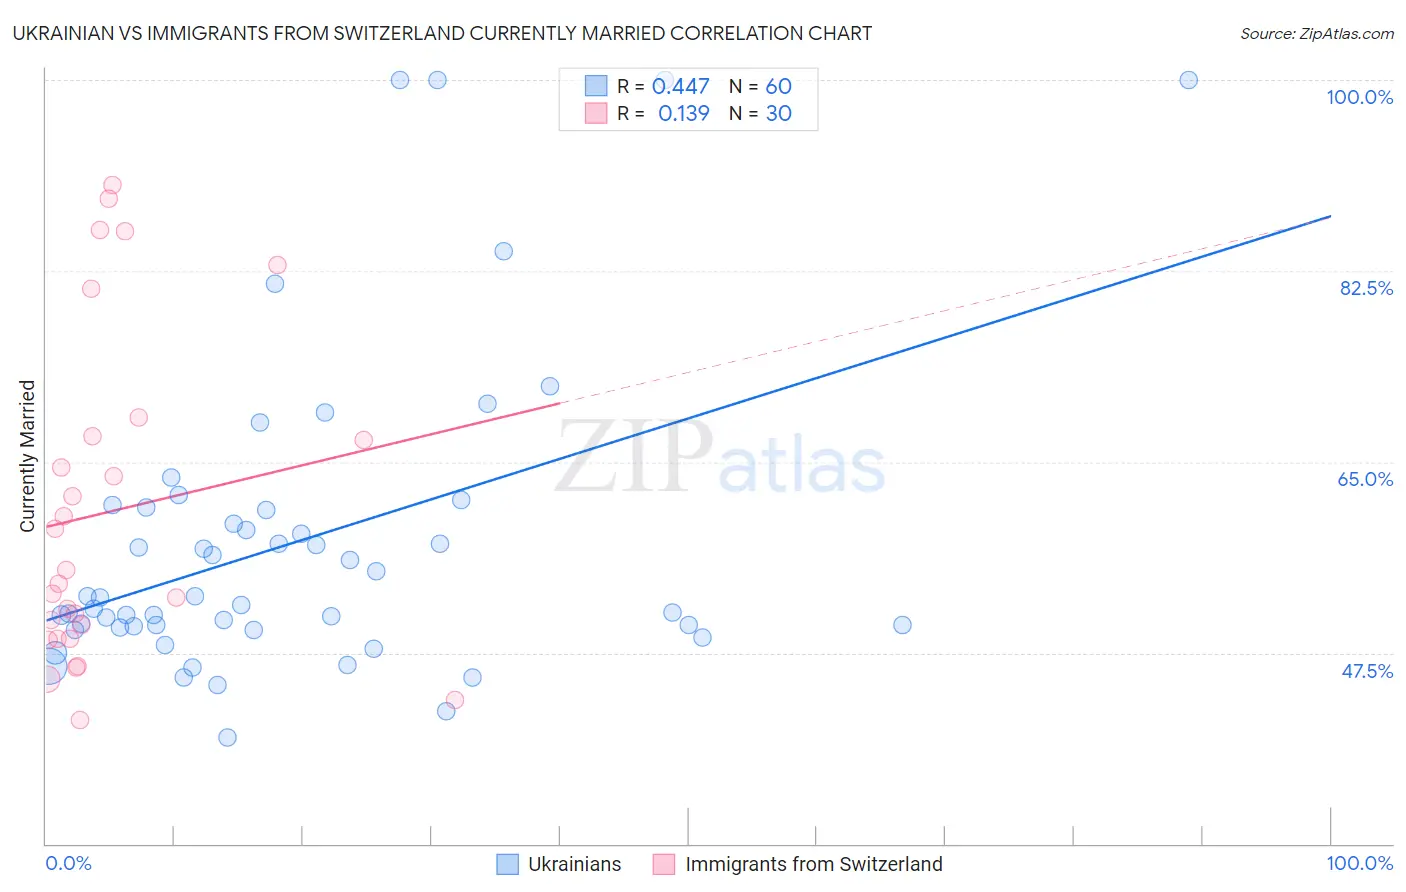
Ukrainian vs Immigrants from Switzerland Currently Married Correlation Chart
The statistical analysis conducted on geographies consisting of 448,616,463 people shows a moderate positive correlation between the proportion of Ukrainians and percentage of population currently married in the United States with a correlation coefficient (R) of 0.447 and weighted average of 48.4%. Similarly, the statistical analysis conducted on geographies consisting of 148,074,779 people shows a poor positive correlation between the proportion of Immigrants from Switzerland and percentage of population currently married in the United States with a correlation coefficient (R) of 0.139 and weighted average of 46.9%, a difference of 3.0%.
Currently Married Correlation Summary
| Measurement | Ukrainian | Immigrants from Switzerland |
| Minimum | 39.7% | 41.3% |
| Maximum | 100.0% | 90.4% |
| Range | 60.3% | 49.1% |
| Mean | 57.7% | 60.5% |
| Median | 52.3% | 54.4% |
| Interquartile 25% (IQ1) | 49.9% | 48.8% |
| Interquartile 75% (IQ3) | 60.7% | 67.3% |
| Interquartile Range (IQR) | 10.8% | 18.5% |
| Standard Deviation (Sample) | 14.2% | 14.9% |
| Standard Deviation (Population) | 14.1% | 14.7% |
Similar Demographics by Currently Married
Demographics Similar to Ukrainians by Currently Married
In terms of currently married, the demographic groups most similar to Ukrainians are Slavic (48.4%, a difference of 0.010%), Immigrants from Czechoslovakia (48.4%, a difference of 0.010%), Tongan (48.3%, a difference of 0.030%), Slovak (48.3%, a difference of 0.040%), and Immigrants from England (48.3%, a difference of 0.050%).
| Demographics | Rating | Rank | Currently Married |
| French | 98.6 /100 | #58 | Exceptional 48.4% |
| Immigrants | Ireland | 98.5 /100 | #59 | Exceptional 48.4% |
| Immigrants | Romania | 98.5 /100 | #60 | Exceptional 48.4% |
| Romanians | 98.5 /100 | #61 | Exceptional 48.4% |
| Asians | 98.5 /100 | #62 | Exceptional 48.4% |
| Slavs | 98.3 /100 | #63 | Exceptional 48.4% |
| Immigrants | Czechoslovakia | 98.3 /100 | #64 | Exceptional 48.4% |
| Ukrainians | 98.3 /100 | #65 | Exceptional 48.4% |
| Tongans | 98.2 /100 | #66 | Exceptional 48.3% |
| Slovaks | 98.2 /100 | #67 | Exceptional 48.3% |
| Immigrants | England | 98.2 /100 | #68 | Exceptional 48.3% |
| Canadians | 98.1 /100 | #69 | Exceptional 48.3% |
| Immigrants | Asia | 97.9 /100 | #70 | Exceptional 48.3% |
| Macedonians | 97.9 /100 | #71 | Exceptional 48.3% |
| Immigrants | Lebanon | 97.6 /100 | #72 | Exceptional 48.2% |
Demographics Similar to Immigrants from Switzerland by Currently Married
In terms of currently married, the demographic groups most similar to Immigrants from Switzerland are Spanish (47.0%, a difference of 0.010%), Immigrants from Venezuela (47.0%, a difference of 0.030%), Albanian (47.0%, a difference of 0.030%), Arab (47.0%, a difference of 0.030%), and Immigrants from Serbia (47.0%, a difference of 0.040%).
| Demographics | Rating | Rank | Currently Married |
| Immigrants | Turkey | 70.0 /100 | #150 | Good 47.0% |
| Chileans | 69.8 /100 | #151 | Good 47.0% |
| Immigrants | Serbia | 68.8 /100 | #152 | Good 47.0% |
| Immigrants | Venezuela | 68.6 /100 | #153 | Good 47.0% |
| Albanians | 68.6 /100 | #154 | Good 47.0% |
| Arabs | 68.6 /100 | #155 | Good 47.0% |
| Spanish | 68.1 /100 | #156 | Good 47.0% |
| Immigrants | Switzerland | 67.8 /100 | #157 | Good 46.9% |
| Cherokee | 66.8 /100 | #158 | Good 46.9% |
| Iraqis | 66.4 /100 | #159 | Good 46.9% |
| Immigrants | Uzbekistan | 66.0 /100 | #160 | Good 46.9% |
| Immigrants | Southern Europe | 65.9 /100 | #161 | Good 46.9% |
| Immigrants | Nonimmigrants | 65.4 /100 | #162 | Good 46.9% |
| Delaware | 64.7 /100 | #163 | Good 46.9% |
| Immigrants | Western Asia | 64.2 /100 | #164 | Good 46.9% |