Immigrants vs Afghan Births to Unmarried Women
COMPARE
Immigrants
Afghan
Births to Unmarried Women
Births to Unmarried Women Comparison
Immigrants
Afghans
32.7%
BIRTHS TO UNMARRIED WOMEN
20.6/ 100
METRIC RATING
197th/ 347
METRIC RANK
27.9%
BIRTHS TO UNMARRIED WOMEN
99.4/ 100
METRIC RATING
54th/ 347
METRIC RANK
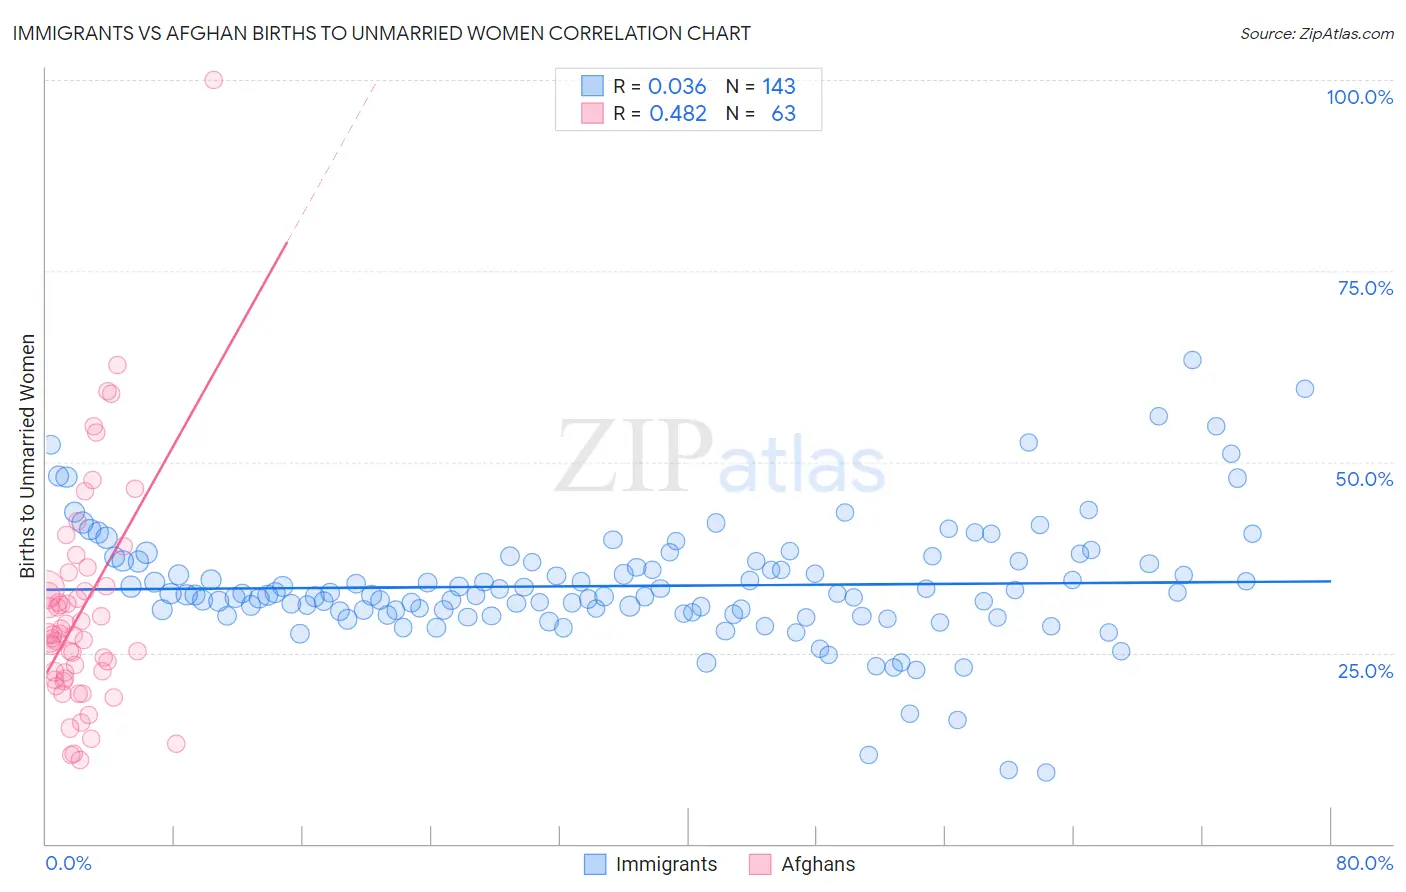
Immigrants vs Afghan Births to Unmarried Women Correlation Chart
The statistical analysis conducted on geographies consisting of 510,959,852 people shows no correlation between the proportion of Immigrants and percentage of births to unmarried women in the United States with a correlation coefficient (R) of 0.036 and weighted average of 32.7%. Similarly, the statistical analysis conducted on geographies consisting of 144,906,952 people shows a moderate positive correlation between the proportion of Afghans and percentage of births to unmarried women in the United States with a correlation coefficient (R) of 0.482 and weighted average of 27.9%, a difference of 17.1%.
Births to Unmarried Women Correlation Summary
| Measurement | Immigrants | Afghan |
| Minimum | 9.4% | 11.0% |
| Maximum | 63.3% | 100.0% |
| Range | 53.9% | 89.0% |
| Mean | 33.8% | 30.6% |
| Median | 32.6% | 27.4% |
| Interquartile 25% (IQ1) | 30.2% | 21.6% |
| Interquartile 75% (IQ3) | 37.0% | 33.7% |
| Interquartile Range (IQR) | 6.8% | 12.1% |
| Standard Deviation (Sample) | 8.0% | 14.8% |
| Standard Deviation (Population) | 8.0% | 14.7% |
Similar Demographics by Births to Unmarried Women
Demographics Similar to Immigrants by Births to Unmarried Women
In terms of births to unmarried women, the demographic groups most similar to Immigrants are Costa Rican (32.7%, a difference of 0.050%), Immigrants from Colombia (32.6%, a difference of 0.15%), Samoan (32.6%, a difference of 0.18%), Immigrants from Thailand (32.8%, a difference of 0.25%), and Immigrants from Germany (32.8%, a difference of 0.26%).
| Demographics | Rating | Rank | Births to Unmarried Women |
| Tlingit-Haida | 32.6 /100 | #190 | Fair 32.2% |
| Irish | 32.4 /100 | #191 | Fair 32.2% |
| Colombians | 31.9 /100 | #192 | Fair 32.2% |
| Fijians | 31.1 /100 | #193 | Fair 32.3% |
| Sudanese | 27.3 /100 | #194 | Fair 32.4% |
| Samoans | 21.9 /100 | #195 | Fair 32.6% |
| Immigrants | Colombia | 21.7 /100 | #196 | Fair 32.6% |
| Immigrants | Immigrants | 20.6 /100 | #197 | Fair 32.7% |
| Costa Ricans | 20.3 /100 | #198 | Fair 32.7% |
| Immigrants | Thailand | 18.9 /100 | #199 | Poor 32.8% |
| Immigrants | Germany | 18.8 /100 | #200 | Poor 32.8% |
| Immigrants | Burma/Myanmar | 16.7 /100 | #201 | Poor 32.9% |
| Immigrants | Micronesia | 16.6 /100 | #202 | Poor 32.9% |
| Ute | 14.4 /100 | #203 | Poor 33.0% |
| Immigrants | Africa | 14.3 /100 | #204 | Poor 33.0% |
Demographics Similar to Afghans by Births to Unmarried Women
In terms of births to unmarried women, the demographic groups most similar to Afghans are Mongolian (27.9%, a difference of 0.040%), Immigrants from Romania (27.9%, a difference of 0.070%), Bhutanese (27.9%, a difference of 0.090%), Macedonian (27.9%, a difference of 0.12%), and Maltese (27.8%, a difference of 0.25%).
| Demographics | Rating | Rank | Births to Unmarried Women |
| Hmong | 99.5 /100 | #47 | Exceptional 27.7% |
| Eastern Europeans | 99.5 /100 | #48 | Exceptional 27.7% |
| Immigrants | Greece | 99.4 /100 | #49 | Exceptional 27.8% |
| Maltese | 99.4 /100 | #50 | Exceptional 27.8% |
| Macedonians | 99.4 /100 | #51 | Exceptional 27.9% |
| Bhutanese | 99.4 /100 | #52 | Exceptional 27.9% |
| Immigrants | Romania | 99.4 /100 | #53 | Exceptional 27.9% |
| Afghans | 99.4 /100 | #54 | Exceptional 27.9% |
| Mongolians | 99.3 /100 | #55 | Exceptional 27.9% |
| Immigrants | Belgium | 99.3 /100 | #56 | Exceptional 28.0% |
| Russians | 99.2 /100 | #57 | Exceptional 28.0% |
| Immigrants | Albania | 99.2 /100 | #58 | Exceptional 28.0% |
| Immigrants | Kazakhstan | 99.1 /100 | #59 | Exceptional 28.1% |
| Immigrants | Turkey | 99.1 /100 | #60 | Exceptional 28.1% |
| Immigrants | North Macedonia | 99.1 /100 | #61 | Exceptional 28.1% |