Immigrants from Uruguay vs Afghan Births to Unmarried Women
COMPARE
Immigrants from Uruguay
Afghan
Births to Unmarried Women
Births to Unmarried Women Comparison
Immigrants from Uruguay
Afghans
33.9%
BIRTHS TO UNMARRIED WOMEN
4.8/ 100
METRIC RATING
222nd/ 347
METRIC RANK
27.9%
BIRTHS TO UNMARRIED WOMEN
99.4/ 100
METRIC RATING
54th/ 347
METRIC RANK
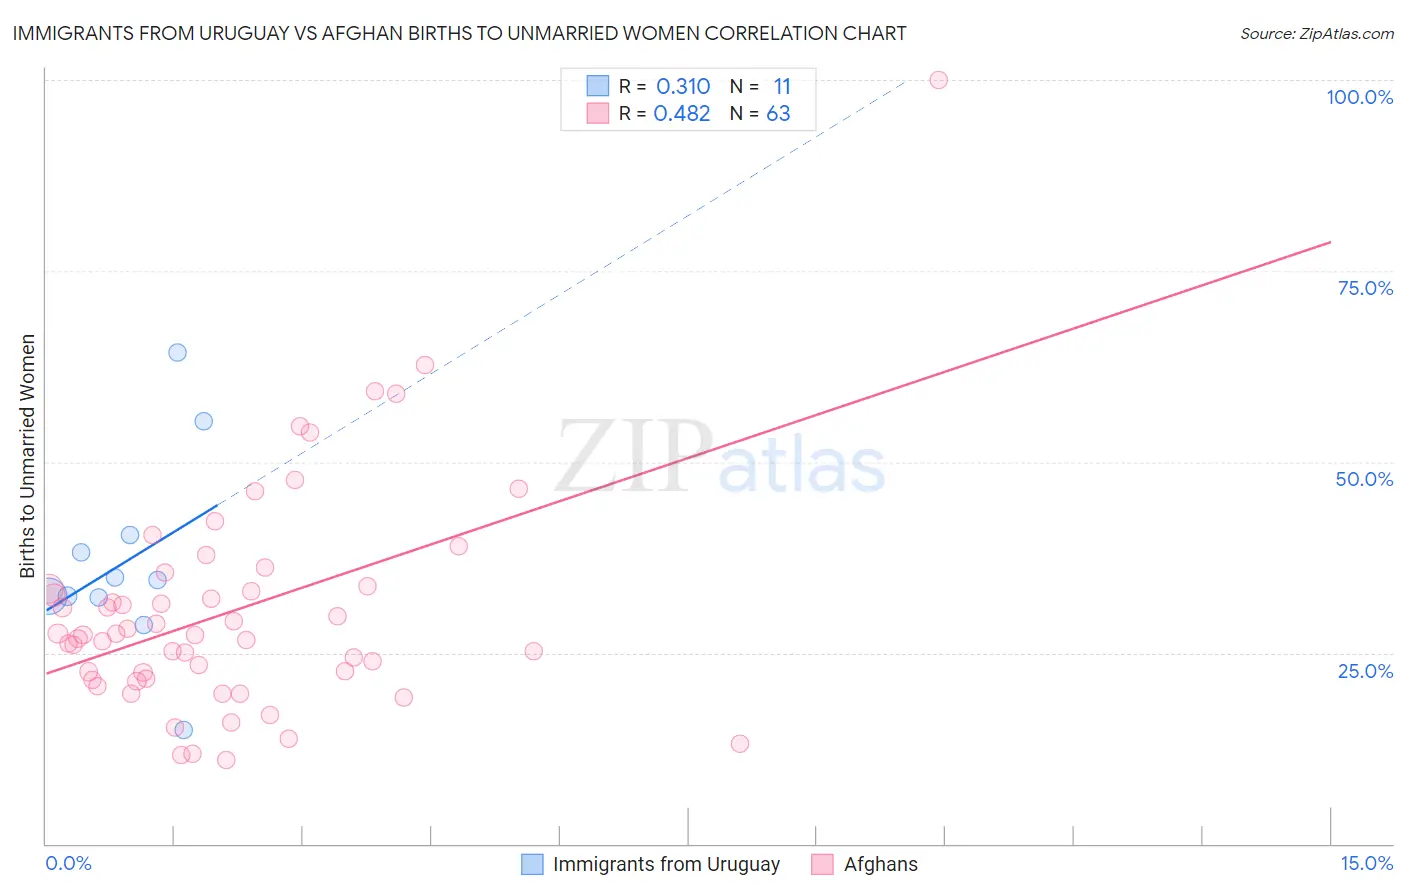
Immigrants from Uruguay vs Afghan Births to Unmarried Women Correlation Chart
The statistical analysis conducted on geographies consisting of 129,349,421 people shows a mild positive correlation between the proportion of Immigrants from Uruguay and percentage of births to unmarried women in the United States with a correlation coefficient (R) of 0.310 and weighted average of 33.9%. Similarly, the statistical analysis conducted on geographies consisting of 144,906,952 people shows a moderate positive correlation between the proportion of Afghans and percentage of births to unmarried women in the United States with a correlation coefficient (R) of 0.482 and weighted average of 27.9%, a difference of 21.5%.
Births to Unmarried Women Correlation Summary
| Measurement | Immigrants from Uruguay | Afghan |
| Minimum | 14.9% | 11.0% |
| Maximum | 64.3% | 100.0% |
| Range | 49.4% | 89.0% |
| Mean | 37.1% | 30.6% |
| Median | 34.5% | 27.4% |
| Interquartile 25% (IQ1) | 32.2% | 21.6% |
| Interquartile 75% (IQ3) | 40.5% | 33.7% |
| Interquartile Range (IQR) | 8.2% | 12.1% |
| Standard Deviation (Sample) | 13.1% | 14.8% |
| Standard Deviation (Population) | 12.5% | 14.7% |
Similar Demographics by Births to Unmarried Women
Demographics Similar to Immigrants from Uruguay by Births to Unmarried Women
In terms of births to unmarried women, the demographic groups most similar to Immigrants from Uruguay are Malaysian (33.9%, a difference of 0.060%), Portuguese (33.8%, a difference of 0.24%), Alsatian (33.8%, a difference of 0.26%), Pennsylvania German (34.0%, a difference of 0.29%), and Immigrants from Laos (34.0%, a difference of 0.29%).
| Demographics | Rating | Rank | Births to Unmarried Women |
| French | 8.7 /100 | #215 | Tragic 33.4% |
| Nepalese | 7.8 /100 | #216 | Tragic 33.5% |
| Spaniards | 7.0 /100 | #217 | Tragic 33.6% |
| Immigrants | Ecuador | 5.9 /100 | #218 | Tragic 33.7% |
| Alsatians | 5.4 /100 | #219 | Tragic 33.8% |
| Portuguese | 5.4 /100 | #220 | Tragic 33.8% |
| Malaysians | 5.0 /100 | #221 | Tragic 33.9% |
| Immigrants | Uruguay | 4.8 /100 | #222 | Tragic 33.9% |
| Pennsylvania Germans | 4.3 /100 | #223 | Tragic 34.0% |
| Immigrants | Laos | 4.3 /100 | #224 | Tragic 34.0% |
| Spanish | 4.0 /100 | #225 | Tragic 34.1% |
| Delaware | 3.3 /100 | #226 | Tragic 34.2% |
| Immigrants | Panama | 3.3 /100 | #227 | Tragic 34.2% |
| Panamanians | 3.3 /100 | #228 | Tragic 34.2% |
| Immigrants | Sierra Leone | 3.1 /100 | #229 | Tragic 34.2% |
Demographics Similar to Afghans by Births to Unmarried Women
In terms of births to unmarried women, the demographic groups most similar to Afghans are Mongolian (27.9%, a difference of 0.040%), Immigrants from Romania (27.9%, a difference of 0.070%), Bhutanese (27.9%, a difference of 0.090%), Macedonian (27.9%, a difference of 0.12%), and Maltese (27.8%, a difference of 0.25%).
| Demographics | Rating | Rank | Births to Unmarried Women |
| Hmong | 99.5 /100 | #47 | Exceptional 27.7% |
| Eastern Europeans | 99.5 /100 | #48 | Exceptional 27.7% |
| Immigrants | Greece | 99.4 /100 | #49 | Exceptional 27.8% |
| Maltese | 99.4 /100 | #50 | Exceptional 27.8% |
| Macedonians | 99.4 /100 | #51 | Exceptional 27.9% |
| Bhutanese | 99.4 /100 | #52 | Exceptional 27.9% |
| Immigrants | Romania | 99.4 /100 | #53 | Exceptional 27.9% |
| Afghans | 99.4 /100 | #54 | Exceptional 27.9% |
| Mongolians | 99.3 /100 | #55 | Exceptional 27.9% |
| Immigrants | Belgium | 99.3 /100 | #56 | Exceptional 28.0% |
| Russians | 99.2 /100 | #57 | Exceptional 28.0% |
| Immigrants | Albania | 99.2 /100 | #58 | Exceptional 28.0% |
| Immigrants | Kazakhstan | 99.1 /100 | #59 | Exceptional 28.1% |
| Immigrants | Turkey | 99.1 /100 | #60 | Exceptional 28.1% |
| Immigrants | North Macedonia | 99.1 /100 | #61 | Exceptional 28.1% |