Ugandan vs Mongolian Currently Married
COMPARE
Ugandan
Mongolian
Currently Married
Currently Married Comparison
Ugandans
Mongolians
44.2%
CURRENTLY MARRIED
0.4/ 100
METRIC RATING
247th/ 347
METRIC RANK
46.4%
CURRENTLY MARRIED
37.6/ 100
METRIC RATING
185th/ 347
METRIC RANK
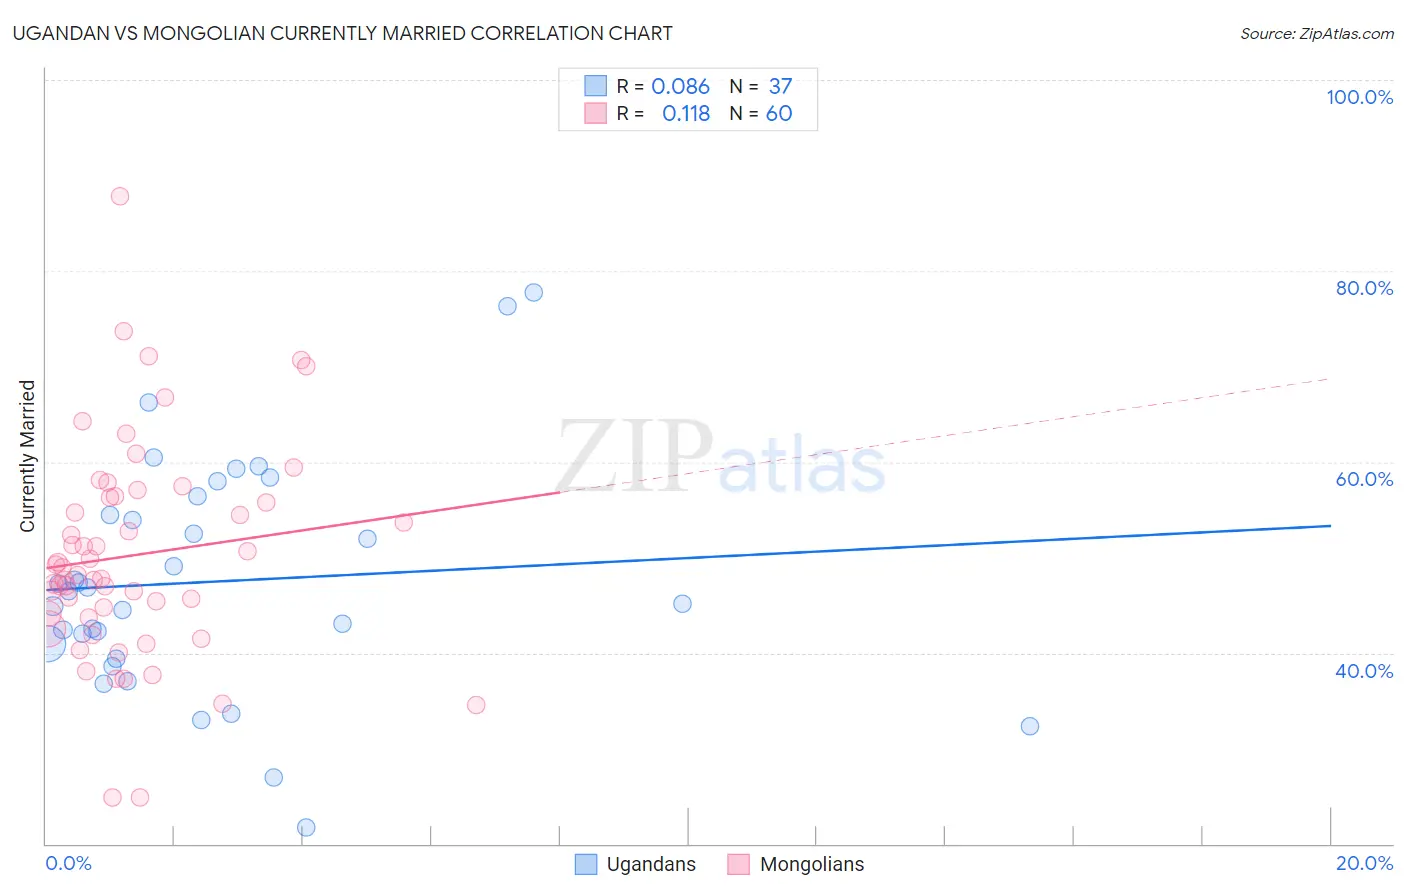
Ugandan vs Mongolian Currently Married Correlation Chart
The statistical analysis conducted on geographies consisting of 94,016,399 people shows a slight positive correlation between the proportion of Ugandans and percentage of population currently married in the United States with a correlation coefficient (R) of 0.086 and weighted average of 44.2%. Similarly, the statistical analysis conducted on geographies consisting of 140,349,335 people shows a poor positive correlation between the proportion of Mongolians and percentage of population currently married in the United States with a correlation coefficient (R) of 0.118 and weighted average of 46.4%, a difference of 4.9%.
Currently Married Correlation Summary
| Measurement | Ugandan | Mongolian |
| Minimum | 21.7% | 24.8% |
| Maximum | 77.7% | 87.8% |
| Range | 56.0% | 63.0% |
| Mean | 47.5% | 50.2% |
| Median | 46.4% | 48.6% |
| Interquartile 25% (IQ1) | 40.1% | 43.9% |
| Interquartile 75% (IQ3) | 55.4% | 56.3% |
| Interquartile Range (IQR) | 15.3% | 12.4% |
| Standard Deviation (Sample) | 12.1% | 11.3% |
| Standard Deviation (Population) | 11.9% | 11.3% |
Similar Demographics by Currently Married
Demographics Similar to Ugandans by Currently Married
In terms of currently married, the demographic groups most similar to Ugandans are Nicaraguan (44.2%, a difference of 0.090%), Immigrants from Cameroon (44.2%, a difference of 0.10%), Immigrants from Eastern Africa (44.2%, a difference of 0.12%), Immigrants from Burma/Myanmar (44.3%, a difference of 0.13%), and Blackfeet (44.2%, a difference of 0.19%).
| Demographics | Rating | Rank | Currently Married |
| Mexican American Indians | 0.7 /100 | #240 | Tragic 44.5% |
| Ethiopians | 0.7 /100 | #241 | Tragic 44.5% |
| Immigrants | Cambodia | 0.7 /100 | #242 | Tragic 44.5% |
| Immigrants | Ethiopia | 0.7 /100 | #243 | Tragic 44.5% |
| Japanese | 0.6 /100 | #244 | Tragic 44.5% |
| Immigrants | Armenia | 0.4 /100 | #245 | Tragic 44.3% |
| Immigrants | Burma/Myanmar | 0.4 /100 | #246 | Tragic 44.3% |
| Ugandans | 0.4 /100 | #247 | Tragic 44.2% |
| Nicaraguans | 0.3 /100 | #248 | Tragic 44.2% |
| Immigrants | Cameroon | 0.3 /100 | #249 | Tragic 44.2% |
| Immigrants | Eastern Africa | 0.3 /100 | #250 | Tragic 44.2% |
| Blackfeet | 0.3 /100 | #251 | Tragic 44.2% |
| Hispanics or Latinos | 0.3 /100 | #252 | Tragic 44.1% |
| Immigrants | Central America | 0.3 /100 | #253 | Tragic 44.1% |
| Vietnamese | 0.2 /100 | #254 | Tragic 44.0% |
Demographics Similar to Mongolians by Currently Married
In terms of currently married, the demographic groups most similar to Mongolians are Immigrants from Chile (46.4%, a difference of 0.030%), Brazilian (46.4%, a difference of 0.070%), Immigrants from Northern Africa (46.5%, a difference of 0.080%), Immigrants from Peru (46.4%, a difference of 0.090%), and Potawatomi (46.5%, a difference of 0.16%).
| Demographics | Rating | Rank | Currently Married |
| Chickasaw | 47.8 /100 | #178 | Average 46.6% |
| Immigrants | Oceania | 44.6 /100 | #179 | Average 46.5% |
| Costa Ricans | 43.7 /100 | #180 | Average 46.5% |
| Ottawa | 43.0 /100 | #181 | Average 46.5% |
| Potawatomi | 41.9 /100 | #182 | Average 46.5% |
| Immigrants | Northern Africa | 39.7 /100 | #183 | Fair 46.5% |
| Brazilians | 39.3 /100 | #184 | Fair 46.4% |
| Mongolians | 37.6 /100 | #185 | Fair 46.4% |
| Immigrants | Chile | 36.8 /100 | #186 | Fair 46.4% |
| Immigrants | Peru | 35.3 /100 | #187 | Fair 46.4% |
| Colombians | 31.8 /100 | #188 | Fair 46.3% |
| Fijians | 30.3 /100 | #189 | Fair 46.3% |
| Choctaw | 29.1 /100 | #190 | Fair 46.3% |
| Immigrants | France | 27.7 /100 | #191 | Fair 46.2% |
| Soviet Union | 25.7 /100 | #192 | Fair 46.2% |