Hispanic or Latino vs Immigrants from Panama Divorced or Separated
COMPARE
Hispanic or Latino
Immigrants from Panama
Divorced or Separated
Divorced or Separated Comparison
Hispanics or Latinos
Immigrants from Panama
12.5%
DIVORCED OR SEPARATED
2.0/ 100
METRIC RATING
245th/ 347
METRIC RANK
12.6%
DIVORCED OR SEPARATED
0.5/ 100
METRIC RATING
263rd/ 347
METRIC RANK
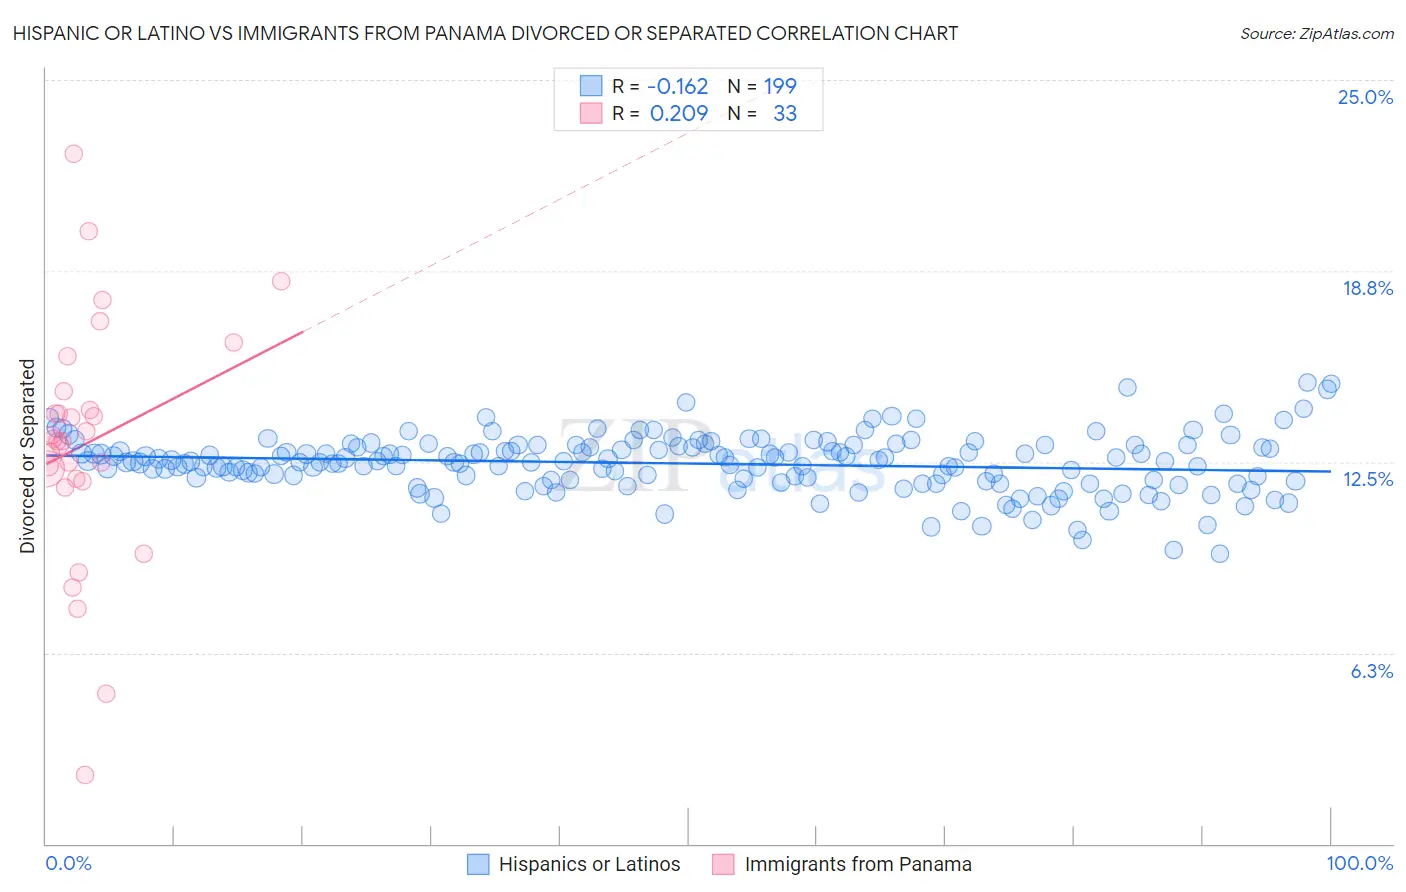
Hispanic or Latino vs Immigrants from Panama Divorced or Separated Correlation Chart
The statistical analysis conducted on geographies consisting of 575,306,240 people shows a poor negative correlation between the proportion of Hispanics or Latinos and percentage of population currently divorced or separated in the United States with a correlation coefficient (R) of -0.162 and weighted average of 12.5%. Similarly, the statistical analysis conducted on geographies consisting of 221,177,980 people shows a weak positive correlation between the proportion of Immigrants from Panama and percentage of population currently divorced or separated in the United States with a correlation coefficient (R) of 0.209 and weighted average of 12.6%, a difference of 1.2%.
Divorced or Separated Correlation Summary
| Measurement | Hispanic or Latino | Immigrants from Panama |
| Minimum | 9.5% | 2.3% |
| Maximum | 15.1% | 22.6% |
| Range | 5.6% | 20.3% |
| Mean | 12.4% | 13.1% |
| Median | 12.5% | 13.2% |
| Interquartile 25% (IQ1) | 11.9% | 11.9% |
| Interquartile 75% (IQ3) | 13.0% | 14.5% |
| Interquartile Range (IQR) | 1.1% | 2.6% |
| Standard Deviation (Sample) | 0.94% | 4.0% |
| Standard Deviation (Population) | 0.93% | 3.9% |
Demographics Similar to Hispanics or Latinos and Immigrants from Panama by Divorced or Separated
In terms of divorced or separated, the demographic groups most similar to Hispanics or Latinos are Immigrants from West Indies (12.5%, a difference of 0.020%), German (12.5%, a difference of 0.050%), Nepalese (12.5%, a difference of 0.080%), Finnish (12.5%, a difference of 0.090%), and Alaska Native (12.4%, a difference of 0.22%). Similarly, the demographic groups most similar to Immigrants from Panama are English (12.6%, a difference of 0.020%), Basque (12.6%, a difference of 0.050%), Immigrants from Dominica (12.6%, a difference of 0.11%), Immigrants from Uruguay (12.6%, a difference of 0.14%), and Yuman (12.6%, a difference of 0.15%).
| Demographics | Rating | Rank | Divorced or Separated |
| Alaska Natives | 2.5 /100 | #244 | Tragic 12.4% |
| Hispanics or Latinos | 2.0 /100 | #245 | Tragic 12.5% |
| Immigrants | West Indies | 1.9 /100 | #246 | Tragic 12.5% |
| Germans | 1.8 /100 | #247 | Tragic 12.5% |
| Nepalese | 1.8 /100 | #248 | Tragic 12.5% |
| Finns | 1.8 /100 | #249 | Tragic 12.5% |
| Irish | 1.3 /100 | #250 | Tragic 12.5% |
| Aleuts | 1.3 /100 | #251 | Tragic 12.5% |
| Liberians | 0.9 /100 | #252 | Tragic 12.6% |
| Somalis | 0.9 /100 | #253 | Tragic 12.6% |
| Senegalese | 0.8 /100 | #254 | Tragic 12.6% |
| Welsh | 0.7 /100 | #255 | Tragic 12.6% |
| Immigrants | Colombia | 0.6 /100 | #256 | Tragic 12.6% |
| Immigrants | Somalia | 0.6 /100 | #257 | Tragic 12.6% |
| Indonesians | 0.6 /100 | #258 | Tragic 12.6% |
| Yuman | 0.6 /100 | #259 | Tragic 12.6% |
| Immigrants | Uruguay | 0.6 /100 | #260 | Tragic 12.6% |
| Immigrants | Dominica | 0.5 /100 | #261 | Tragic 12.6% |
| Basques | 0.5 /100 | #262 | Tragic 12.6% |
| Immigrants | Panama | 0.5 /100 | #263 | Tragic 12.6% |
| English | 0.5 /100 | #264 | Tragic 12.6% |