Turkish vs Slovene Family Households
COMPARE
Turkish
Slovene
Family Households
Family Households Comparison
Turks
Slovenes
63.6%
FAMILY HOUSEHOLDS
4.5/ 100
METRIC RATING
224th/ 347
METRIC RANK
62.4%
FAMILY HOUSEHOLDS
0.0/ 100
METRIC RATING
296th/ 347
METRIC RANK
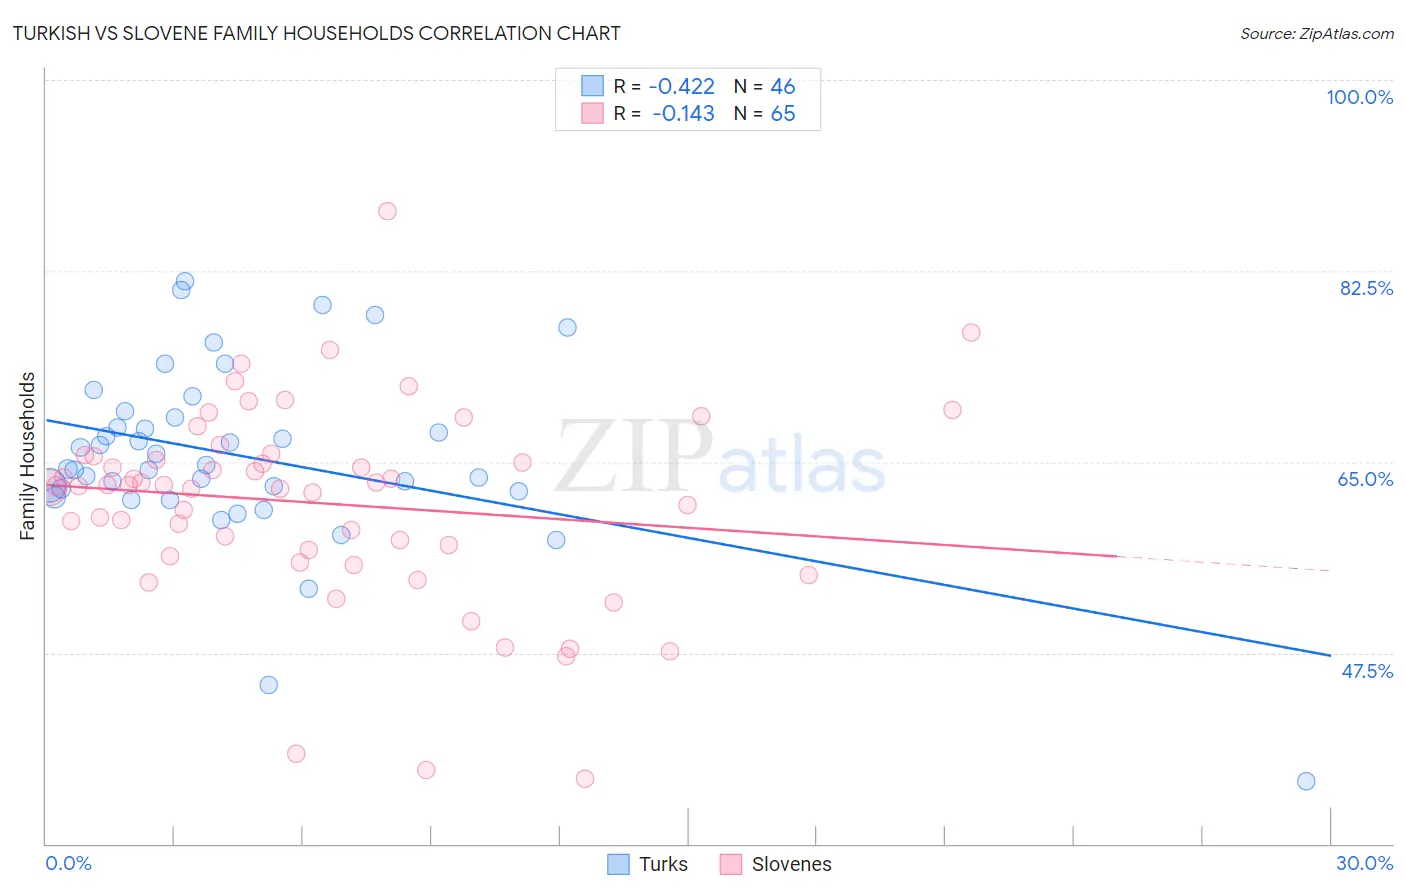
Turkish vs Slovene Family Households Correlation Chart
The statistical analysis conducted on geographies consisting of 271,710,288 people shows a moderate negative correlation between the proportion of Turks and percentage of family households in the United States with a correlation coefficient (R) of -0.422 and weighted average of 63.6%. Similarly, the statistical analysis conducted on geographies consisting of 261,256,985 people shows a poor negative correlation between the proportion of Slovenes and percentage of family households in the United States with a correlation coefficient (R) of -0.143 and weighted average of 62.4%, a difference of 1.9%.
Family Households Correlation Summary
| Measurement | Turkish | Slovene |
| Minimum | 35.7% | 35.9% |
| Maximum | 81.5% | 88.0% |
| Range | 45.8% | 52.0% |
| Mean | 65.5% | 61.2% |
| Median | 64.5% | 62.8% |
| Interquartile 25% (IQ1) | 62.3% | 56.6% |
| Interquartile 75% (IQ3) | 69.1% | 65.5% |
| Interquartile Range (IQR) | 6.8% | 9.0% |
| Standard Deviation (Sample) | 8.4% | 9.1% |
| Standard Deviation (Population) | 8.3% | 9.1% |
Similar Demographics by Family Households
Demographics Similar to Turks by Family Households
In terms of family households, the demographic groups most similar to Turks are Immigrants from Hungary (63.6%, a difference of 0.010%), Immigrants from Bahamas (63.6%, a difference of 0.020%), Trinidadian and Tobagonian (63.6%, a difference of 0.030%), Immigrants from Belarus (63.7%, a difference of 0.070%), and French Canadian (63.7%, a difference of 0.070%).
| Demographics | Rating | Rank | Family Households |
| Osage | 7.0 /100 | #217 | Tragic 63.7% |
| Marshallese | 6.9 /100 | #218 | Tragic 63.7% |
| Macedonians | 6.5 /100 | #219 | Tragic 63.7% |
| Immigrants | Europe | 6.4 /100 | #220 | Tragic 63.7% |
| Immigrants | South Africa | 5.9 /100 | #221 | Tragic 63.7% |
| Immigrants | Belarus | 5.5 /100 | #222 | Tragic 63.7% |
| French Canadians | 5.4 /100 | #223 | Tragic 63.7% |
| Turks | 4.5 /100 | #224 | Tragic 63.6% |
| Immigrants | Hungary | 4.3 /100 | #225 | Tragic 63.6% |
| Immigrants | Bahamas | 4.2 /100 | #226 | Tragic 63.6% |
| Trinidadians and Tobagonians | 4.1 /100 | #227 | Tragic 63.6% |
| Blackfeet | 3.6 /100 | #228 | Tragic 63.6% |
| Bulgarians | 3.4 /100 | #229 | Tragic 63.6% |
| Immigrants | Brazil | 3.0 /100 | #230 | Tragic 63.6% |
| Immigrants | Greece | 2.9 /100 | #231 | Tragic 63.5% |
Demographics Similar to Slovenes by Family Households
In terms of family households, the demographic groups most similar to Slovenes are Okinawan (62.5%, a difference of 0.010%), French American Indian (62.4%, a difference of 0.010%), Barbadian (62.5%, a difference of 0.020%), Immigrants from Spain (62.4%, a difference of 0.040%), and Immigrants from Sweden (62.5%, a difference of 0.090%).
| Demographics | Rating | Rank | Family Households |
| Immigrants | Nepal | 0.1 /100 | #289 | Tragic 62.7% |
| Immigrants | Grenada | 0.0 /100 | #290 | Tragic 62.6% |
| U.S. Virgin Islanders | 0.0 /100 | #291 | Tragic 62.6% |
| Immigrants | Burma/Myanmar | 0.0 /100 | #292 | Tragic 62.6% |
| Immigrants | Sweden | 0.0 /100 | #293 | Tragic 62.5% |
| Barbadians | 0.0 /100 | #294 | Tragic 62.5% |
| Okinawans | 0.0 /100 | #295 | Tragic 62.5% |
| Slovenes | 0.0 /100 | #296 | Tragic 62.4% |
| French American Indians | 0.0 /100 | #297 | Tragic 62.4% |
| Immigrants | Spain | 0.0 /100 | #298 | Tragic 62.4% |
| Immigrants | Kuwait | 0.0 /100 | #299 | Tragic 62.4% |
| Immigrants | Africa | 0.0 /100 | #300 | Tragic 62.4% |
| Immigrants | Albania | 0.0 /100 | #301 | Tragic 62.4% |
| Immigrants | Kenya | 0.0 /100 | #302 | Tragic 62.3% |
| Cree | 0.0 /100 | #303 | Tragic 62.3% |