Turkish vs Immigrants from Sri Lanka Family Households
COMPARE
Turkish
Immigrants from Sri Lanka
Family Households
Family Households Comparison
Turks
Immigrants from Sri Lanka
63.6%
FAMILY HOUSEHOLDS
4.5/ 100
METRIC RATING
224th/ 347
METRIC RANK
65.1%
FAMILY HOUSEHOLDS
98.0/ 100
METRIC RATING
102nd/ 347
METRIC RANK
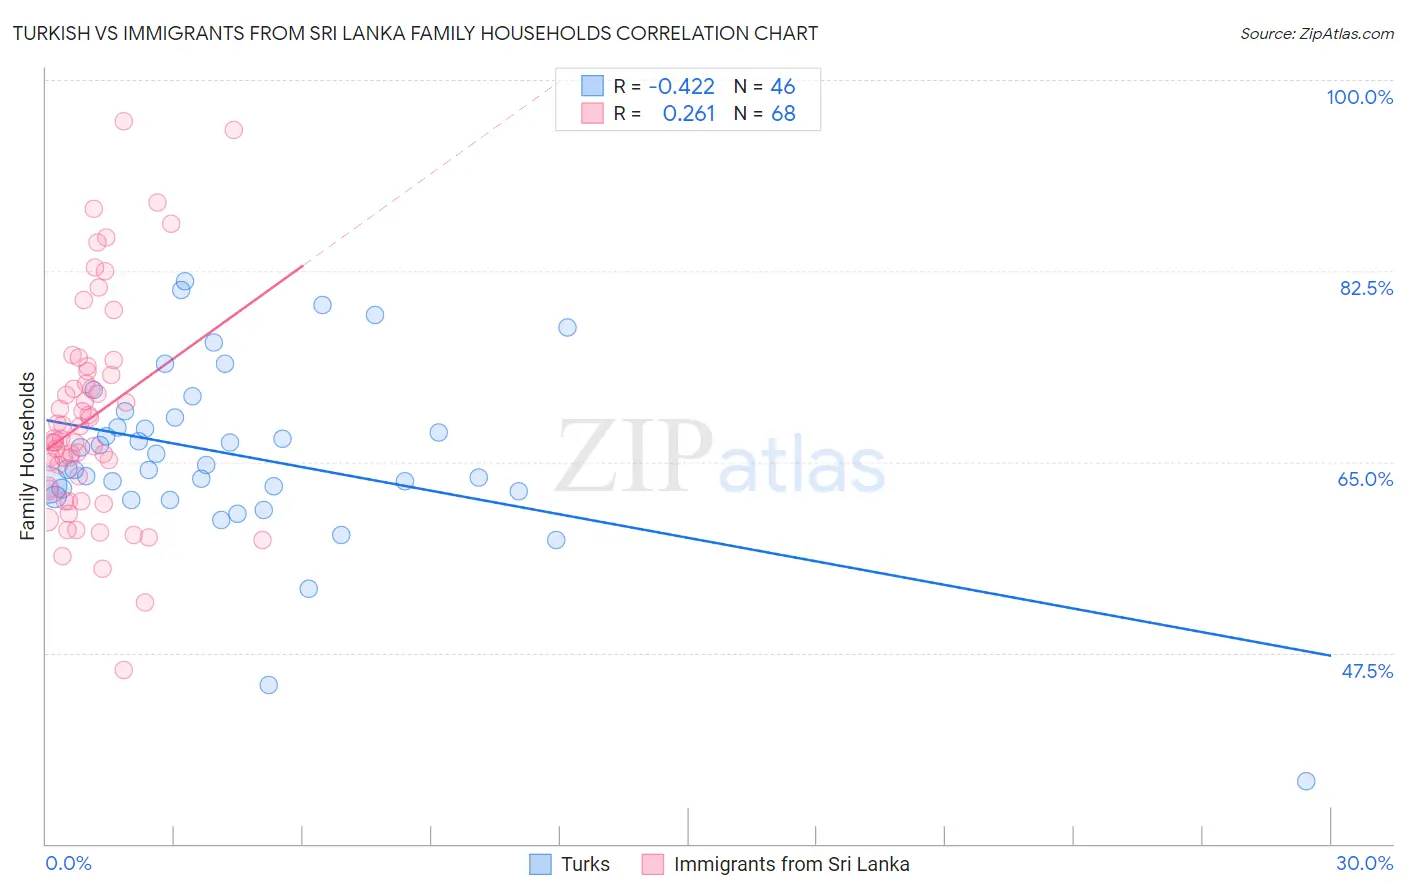
Turkish vs Immigrants from Sri Lanka Family Households Correlation Chart
The statistical analysis conducted on geographies consisting of 271,710,288 people shows a moderate negative correlation between the proportion of Turks and percentage of family households in the United States with a correlation coefficient (R) of -0.422 and weighted average of 63.6%. Similarly, the statistical analysis conducted on geographies consisting of 149,689,020 people shows a weak positive correlation between the proportion of Immigrants from Sri Lanka and percentage of family households in the United States with a correlation coefficient (R) of 0.261 and weighted average of 65.1%, a difference of 2.4%.
Family Households Correlation Summary
| Measurement | Turkish | Immigrants from Sri Lanka |
| Minimum | 35.7% | 45.9% |
| Maximum | 81.5% | 96.3% |
| Range | 45.8% | 50.3% |
| Mean | 65.5% | 69.0% |
| Median | 64.5% | 67.0% |
| Interquartile 25% (IQ1) | 62.3% | 62.5% |
| Interquartile 75% (IQ3) | 69.1% | 73.1% |
| Interquartile Range (IQR) | 6.8% | 10.6% |
| Standard Deviation (Sample) | 8.4% | 9.9% |
| Standard Deviation (Population) | 8.3% | 9.8% |
Similar Demographics by Family Households
Demographics Similar to Turks by Family Households
In terms of family households, the demographic groups most similar to Turks are Immigrants from Hungary (63.6%, a difference of 0.010%), Immigrants from Bahamas (63.6%, a difference of 0.020%), Trinidadian and Tobagonian (63.6%, a difference of 0.030%), Immigrants from Belarus (63.7%, a difference of 0.070%), and French Canadian (63.7%, a difference of 0.070%).
| Demographics | Rating | Rank | Family Households |
| Osage | 7.0 /100 | #217 | Tragic 63.7% |
| Marshallese | 6.9 /100 | #218 | Tragic 63.7% |
| Macedonians | 6.5 /100 | #219 | Tragic 63.7% |
| Immigrants | Europe | 6.4 /100 | #220 | Tragic 63.7% |
| Immigrants | South Africa | 5.9 /100 | #221 | Tragic 63.7% |
| Immigrants | Belarus | 5.5 /100 | #222 | Tragic 63.7% |
| French Canadians | 5.4 /100 | #223 | Tragic 63.7% |
| Turks | 4.5 /100 | #224 | Tragic 63.6% |
| Immigrants | Hungary | 4.3 /100 | #225 | Tragic 63.6% |
| Immigrants | Bahamas | 4.2 /100 | #226 | Tragic 63.6% |
| Trinidadians and Tobagonians | 4.1 /100 | #227 | Tragic 63.6% |
| Blackfeet | 3.6 /100 | #228 | Tragic 63.6% |
| Bulgarians | 3.4 /100 | #229 | Tragic 63.6% |
| Immigrants | Brazil | 3.0 /100 | #230 | Tragic 63.6% |
| Immigrants | Greece | 2.9 /100 | #231 | Tragic 63.5% |
Demographics Similar to Immigrants from Sri Lanka by Family Households
In terms of family households, the demographic groups most similar to Immigrants from Sri Lanka are Haitian (65.2%, a difference of 0.020%), Chilean (65.2%, a difference of 0.020%), Indian (Asian) (65.1%, a difference of 0.020%), Spaniard (65.1%, a difference of 0.020%), and Central American Indian (65.2%, a difference of 0.060%).
| Demographics | Rating | Rank | Family Households |
| Immigrants | Portugal | 98.6 /100 | #95 | Exceptional 65.2% |
| Swiss | 98.6 /100 | #96 | Exceptional 65.2% |
| Guatemalans | 98.6 /100 | #97 | Exceptional 65.2% |
| Immigrants | Syria | 98.4 /100 | #98 | Exceptional 65.2% |
| Central American Indians | 98.3 /100 | #99 | Exceptional 65.2% |
| Haitians | 98.1 /100 | #100 | Exceptional 65.2% |
| Chileans | 98.1 /100 | #101 | Exceptional 65.2% |
| Immigrants | Sri Lanka | 98.0 /100 | #102 | Exceptional 65.1% |
| Indians (Asian) | 97.9 /100 | #103 | Exceptional 65.1% |
| Spaniards | 97.8 /100 | #104 | Exceptional 65.1% |
| English | 97.4 /100 | #105 | Exceptional 65.1% |
| Whites/Caucasians | 97.3 /100 | #106 | Exceptional 65.1% |
| Alaska Natives | 97.3 /100 | #107 | Exceptional 65.1% |
| Palestinians | 97.2 /100 | #108 | Exceptional 65.1% |
| Immigrants | Guatemala | 96.9 /100 | #109 | Exceptional 65.0% |