Filipino vs Slovene Family Households
COMPARE
Filipino
Slovene
Family Households
Family Households Comparison
Filipinos
Slovenes
65.9%
FAMILY HOUSEHOLDS
99.9/ 100
METRIC RATING
67th/ 347
METRIC RANK
62.4%
FAMILY HOUSEHOLDS
0.0/ 100
METRIC RATING
296th/ 347
METRIC RANK
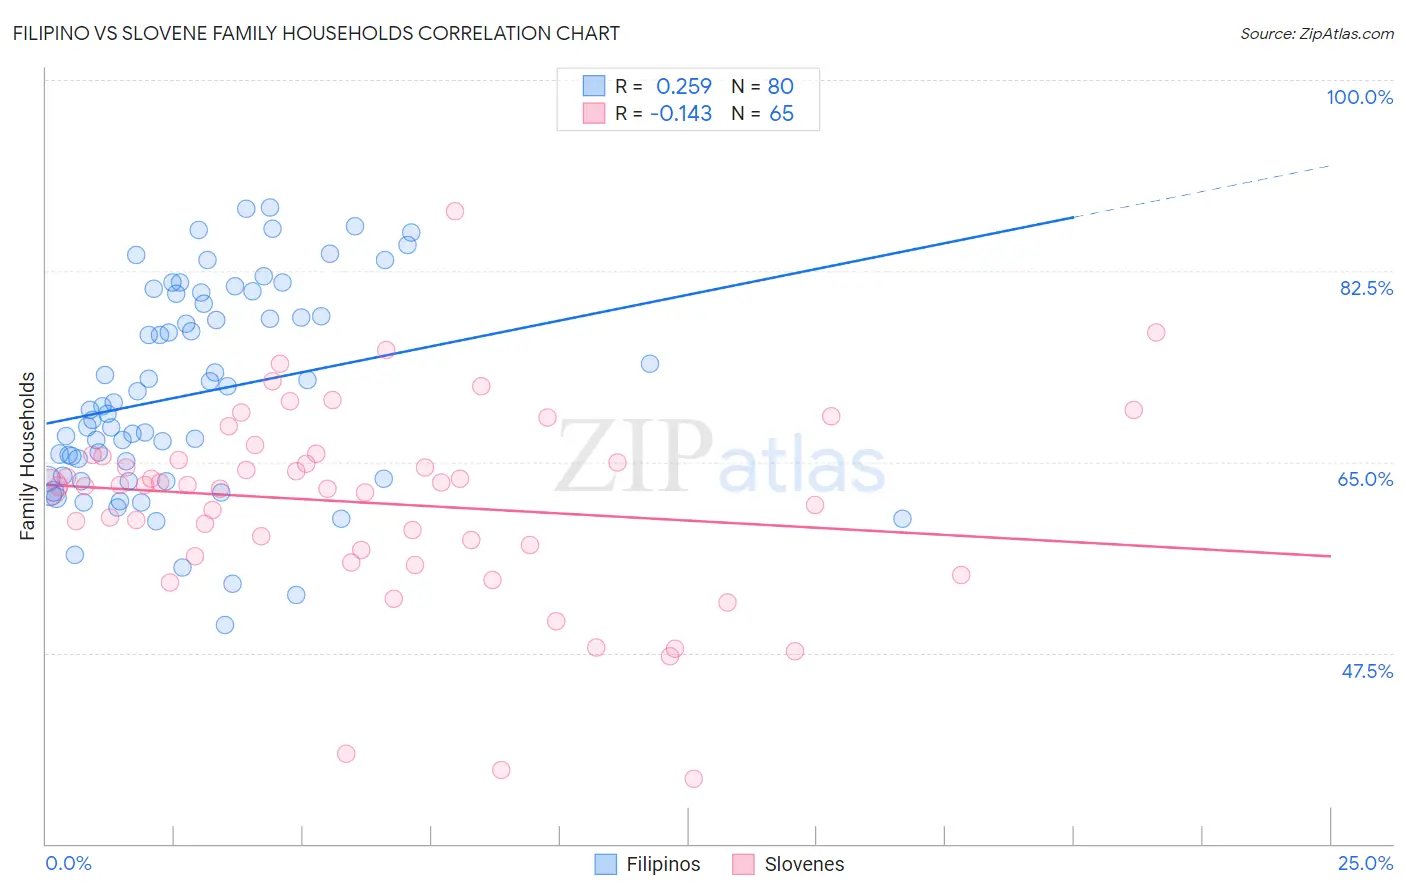
Filipino vs Slovene Family Households Correlation Chart
The statistical analysis conducted on geographies consisting of 254,177,261 people shows a weak positive correlation between the proportion of Filipinos and percentage of family households in the United States with a correlation coefficient (R) of 0.259 and weighted average of 65.9%. Similarly, the statistical analysis conducted on geographies consisting of 261,256,985 people shows a poor negative correlation between the proportion of Slovenes and percentage of family households in the United States with a correlation coefficient (R) of -0.143 and weighted average of 62.4%, a difference of 5.5%.
Family Households Correlation Summary
| Measurement | Filipino | Slovene |
| Minimum | 50.0% | 35.9% |
| Maximum | 88.3% | 88.0% |
| Range | 38.3% | 52.0% |
| Mean | 71.2% | 61.2% |
| Median | 69.9% | 62.8% |
| Interquartile 25% (IQ1) | 63.5% | 56.6% |
| Interquartile 75% (IQ3) | 80.0% | 65.5% |
| Interquartile Range (IQR) | 16.5% | 9.0% |
| Standard Deviation (Sample) | 9.4% | 9.1% |
| Standard Deviation (Population) | 9.4% | 9.1% |
Similar Demographics by Family Households
Demographics Similar to Filipinos by Family Households
In terms of family households, the demographic groups most similar to Filipinos are Fijian (65.9%, a difference of 0.0%), Japanese (65.9%, a difference of 0.020%), Costa Rican (65.9%, a difference of 0.040%), Pima (65.9%, a difference of 0.050%), and Malaysian (65.9%, a difference of 0.050%).
| Demographics | Rating | Rank | Family Households |
| South Americans | 100.0 /100 | #60 | Exceptional 66.0% |
| Danes | 100.0 /100 | #61 | Exceptional 66.0% |
| Central Americans | 100.0 /100 | #62 | Exceptional 66.0% |
| Immigrants | Indonesia | 100.0 /100 | #63 | Exceptional 66.0% |
| Pima | 99.9 /100 | #64 | Exceptional 65.9% |
| Costa Ricans | 99.9 /100 | #65 | Exceptional 65.9% |
| Fijians | 99.9 /100 | #66 | Exceptional 65.9% |
| Filipinos | 99.9 /100 | #67 | Exceptional 65.9% |
| Japanese | 99.9 /100 | #68 | Exceptional 65.9% |
| Malaysians | 99.9 /100 | #69 | Exceptional 65.9% |
| Immigrants | Afghanistan | 99.9 /100 | #70 | Exceptional 65.9% |
| Bhutanese | 99.9 /100 | #71 | Exceptional 65.9% |
| Portuguese | 99.9 /100 | #72 | Exceptional 65.8% |
| Laotians | 99.9 /100 | #73 | Exceptional 65.8% |
| Burmese | 99.9 /100 | #74 | Exceptional 65.7% |
Demographics Similar to Slovenes by Family Households
In terms of family households, the demographic groups most similar to Slovenes are Okinawan (62.5%, a difference of 0.010%), French American Indian (62.4%, a difference of 0.010%), Barbadian (62.5%, a difference of 0.020%), Immigrants from Spain (62.4%, a difference of 0.040%), and Immigrants from Sweden (62.5%, a difference of 0.090%).
| Demographics | Rating | Rank | Family Households |
| Immigrants | Nepal | 0.1 /100 | #289 | Tragic 62.7% |
| Immigrants | Grenada | 0.0 /100 | #290 | Tragic 62.6% |
| U.S. Virgin Islanders | 0.0 /100 | #291 | Tragic 62.6% |
| Immigrants | Burma/Myanmar | 0.0 /100 | #292 | Tragic 62.6% |
| Immigrants | Sweden | 0.0 /100 | #293 | Tragic 62.5% |
| Barbadians | 0.0 /100 | #294 | Tragic 62.5% |
| Okinawans | 0.0 /100 | #295 | Tragic 62.5% |
| Slovenes | 0.0 /100 | #296 | Tragic 62.4% |
| French American Indians | 0.0 /100 | #297 | Tragic 62.4% |
| Immigrants | Spain | 0.0 /100 | #298 | Tragic 62.4% |
| Immigrants | Kuwait | 0.0 /100 | #299 | Tragic 62.4% |
| Immigrants | Africa | 0.0 /100 | #300 | Tragic 62.4% |
| Immigrants | Albania | 0.0 /100 | #301 | Tragic 62.4% |
| Immigrants | Kenya | 0.0 /100 | #302 | Tragic 62.3% |
| Cree | 0.0 /100 | #303 | Tragic 62.3% |