Turkish vs Immigrants from Cambodia Family Households
COMPARE
Turkish
Immigrants from Cambodia
Family Households
Family Households Comparison
Turks
Immigrants from Cambodia
63.6%
FAMILY HOUSEHOLDS
4.5/ 100
METRIC RATING
224th/ 347
METRIC RANK
65.4%
FAMILY HOUSEHOLDS
99.5/ 100
METRIC RATING
85th/ 347
METRIC RANK
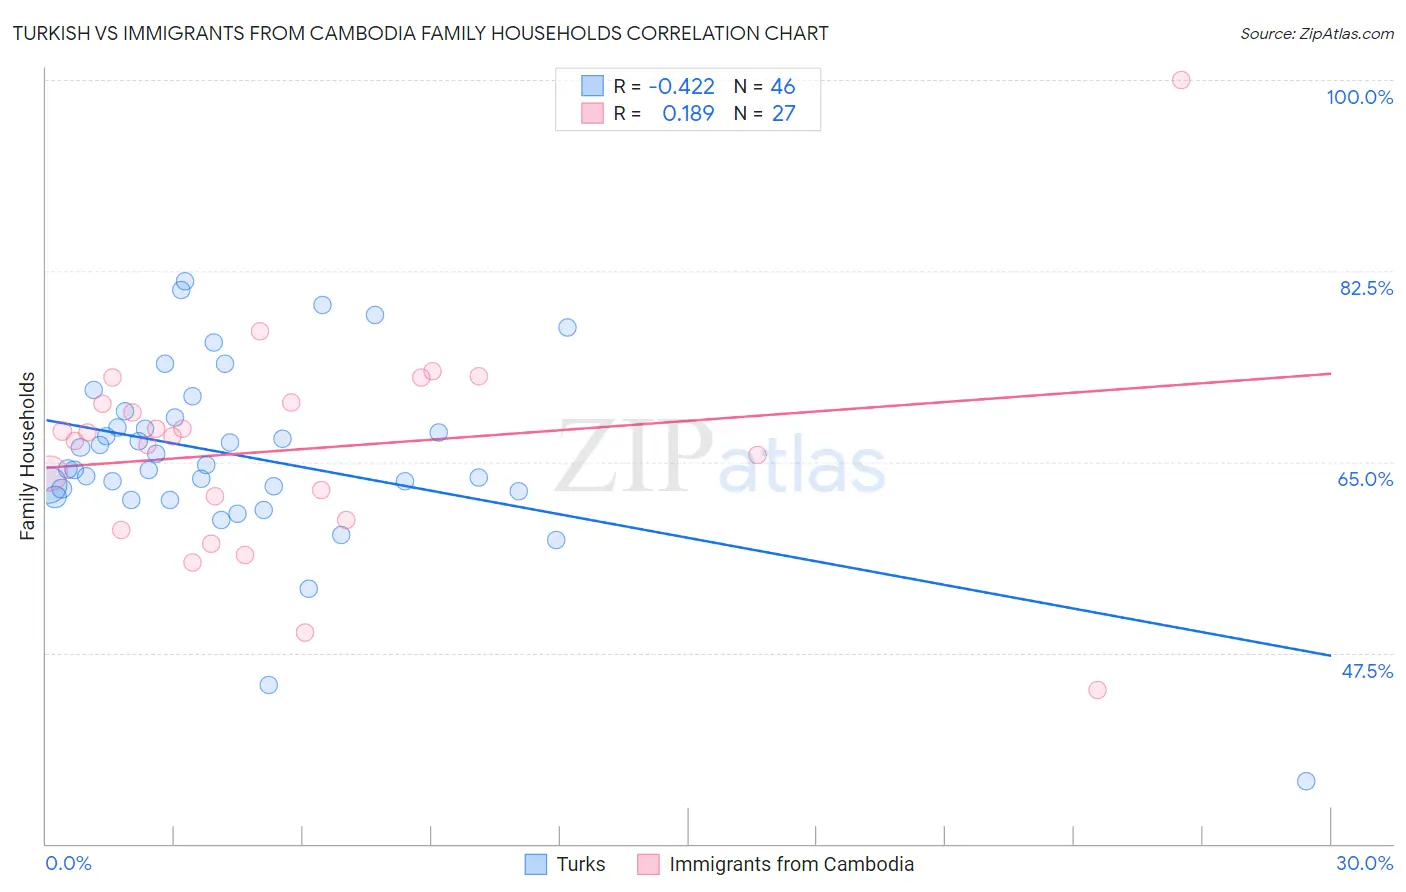
Turkish vs Immigrants from Cambodia Family Households Correlation Chart
The statistical analysis conducted on geographies consisting of 271,710,288 people shows a moderate negative correlation between the proportion of Turks and percentage of family households in the United States with a correlation coefficient (R) of -0.422 and weighted average of 63.6%. Similarly, the statistical analysis conducted on geographies consisting of 205,129,465 people shows a poor positive correlation between the proportion of Immigrants from Cambodia and percentage of family households in the United States with a correlation coefficient (R) of 0.189 and weighted average of 65.4%, a difference of 2.8%.
Family Households Correlation Summary
| Measurement | Turkish | Immigrants from Cambodia |
| Minimum | 35.7% | 44.0% |
| Maximum | 81.5% | 100.0% |
| Range | 45.8% | 56.0% |
| Mean | 65.5% | 66.2% |
| Median | 64.5% | 67.4% |
| Interquartile 25% (IQ1) | 62.3% | 59.7% |
| Interquartile 75% (IQ3) | 69.1% | 70.5% |
| Interquartile Range (IQR) | 6.8% | 10.7% |
| Standard Deviation (Sample) | 8.4% | 10.2% |
| Standard Deviation (Population) | 8.3% | 10.0% |
Similar Demographics by Family Households
Demographics Similar to Turks by Family Households
In terms of family households, the demographic groups most similar to Turks are Immigrants from Hungary (63.6%, a difference of 0.010%), Immigrants from Bahamas (63.6%, a difference of 0.020%), Trinidadian and Tobagonian (63.6%, a difference of 0.030%), Immigrants from Belarus (63.7%, a difference of 0.070%), and French Canadian (63.7%, a difference of 0.070%).
| Demographics | Rating | Rank | Family Households |
| Osage | 7.0 /100 | #217 | Tragic 63.7% |
| Marshallese | 6.9 /100 | #218 | Tragic 63.7% |
| Macedonians | 6.5 /100 | #219 | Tragic 63.7% |
| Immigrants | Europe | 6.4 /100 | #220 | Tragic 63.7% |
| Immigrants | South Africa | 5.9 /100 | #221 | Tragic 63.7% |
| Immigrants | Belarus | 5.5 /100 | #222 | Tragic 63.7% |
| French Canadians | 5.4 /100 | #223 | Tragic 63.7% |
| Turks | 4.5 /100 | #224 | Tragic 63.6% |
| Immigrants | Hungary | 4.3 /100 | #225 | Tragic 63.6% |
| Immigrants | Bahamas | 4.2 /100 | #226 | Tragic 63.6% |
| Trinidadians and Tobagonians | 4.1 /100 | #227 | Tragic 63.6% |
| Blackfeet | 3.6 /100 | #228 | Tragic 63.6% |
| Bulgarians | 3.4 /100 | #229 | Tragic 63.6% |
| Immigrants | Brazil | 3.0 /100 | #230 | Tragic 63.6% |
| Immigrants | Greece | 2.9 /100 | #231 | Tragic 63.5% |
Demographics Similar to Immigrants from Cambodia by Family Households
In terms of family households, the demographic groups most similar to Immigrants from Cambodia are Egyptian (65.4%, a difference of 0.050%), American (65.5%, a difference of 0.11%), Immigrants from Lebanon (65.5%, a difference of 0.13%), Immigrants from Guyana (65.5%, a difference of 0.13%), and Immigrants from Egypt (65.3%, a difference of 0.14%).
| Demographics | Rating | Rank | Family Households |
| Yaqui | 99.8 /100 | #78 | Exceptional 65.6% |
| Immigrants | Costa Rica | 99.8 /100 | #79 | Exceptional 65.6% |
| Puget Sound Salish | 99.8 /100 | #80 | Exceptional 65.6% |
| Jordanians | 99.7 /100 | #81 | Exceptional 65.5% |
| Immigrants | Lebanon | 99.7 /100 | #82 | Exceptional 65.5% |
| Immigrants | Guyana | 99.6 /100 | #83 | Exceptional 65.5% |
| Americans | 99.6 /100 | #84 | Exceptional 65.5% |
| Immigrants | Cambodia | 99.5 /100 | #85 | Exceptional 65.4% |
| Egyptians | 99.4 /100 | #86 | Exceptional 65.4% |
| Immigrants | Egypt | 99.2 /100 | #87 | Exceptional 65.3% |
| Immigrants | Haiti | 99.1 /100 | #88 | Exceptional 65.3% |
| Immigrants | Caribbean | 99.1 /100 | #89 | Exceptional 65.3% |
| Immigrants | Laos | 99.1 /100 | #90 | Exceptional 65.3% |
| Crow | 98.9 /100 | #91 | Exceptional 65.3% |
| Hopi | 98.8 /100 | #92 | Exceptional 65.3% |