Tsimshian vs Dutch West Indian Family Households
COMPARE
Tsimshian
Dutch West Indian
Family Households
Family Households Comparison
Tsimshian
Dutch West Indians
67.1%
FAMILY HOUSEHOLDS
100.0/ 100
METRIC RATING
37th/ 347
METRIC RANK
64.3%
FAMILY HOUSEHOLDS
53.9/ 100
METRIC RATING
172nd/ 347
METRIC RANK
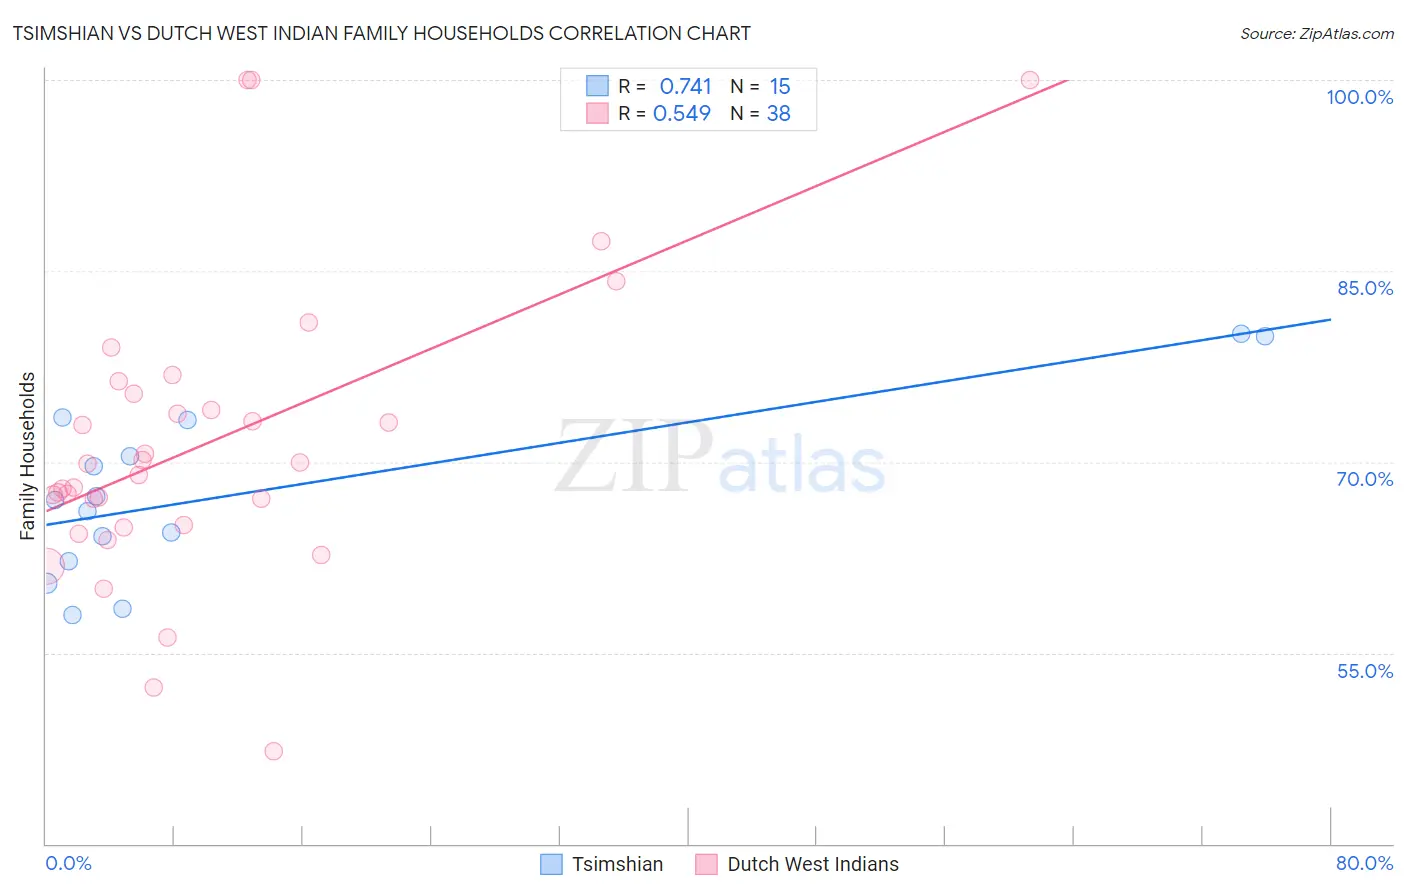
Tsimshian vs Dutch West Indian Family Households Correlation Chart
The statistical analysis conducted on geographies consisting of 15,626,544 people shows a strong positive correlation between the proportion of Tsimshian and percentage of family households in the United States with a correlation coefficient (R) of 0.741 and weighted average of 67.1%. Similarly, the statistical analysis conducted on geographies consisting of 85,766,530 people shows a substantial positive correlation between the proportion of Dutch West Indians and percentage of family households in the United States with a correlation coefficient (R) of 0.549 and weighted average of 64.3%, a difference of 4.3%.
Family Households Correlation Summary
| Measurement | Tsimshian | Dutch West Indian |
| Minimum | 58.0% | 47.2% |
| Maximum | 80.1% | 100.0% |
| Range | 22.1% | 52.8% |
| Mean | 67.7% | 71.4% |
| Median | 67.0% | 69.4% |
| Interquartile 25% (IQ1) | 62.2% | 65.0% |
| Interquartile 75% (IQ3) | 73.3% | 75.3% |
| Interquartile Range (IQR) | 11.1% | 10.3% |
| Standard Deviation (Sample) | 6.9% | 11.5% |
| Standard Deviation (Population) | 6.7% | 11.4% |
Similar Demographics by Family Households
Demographics Similar to Tsimshian by Family Households
In terms of family households, the demographic groups most similar to Tsimshian are Peruvian (67.1%, a difference of 0.070%), Tohono O'odham (67.1%, a difference of 0.080%), Mexican American Indian (67.0%, a difference of 0.10%), Immigrants from El Salvador (67.0%, a difference of 0.12%), and Salvadoran (67.2%, a difference of 0.13%).
| Demographics | Rating | Rank | Family Households |
| Immigrants | Peru | 100.0 /100 | #30 | Exceptional 67.2% |
| Immigrants | Latin America | 100.0 /100 | #31 | Exceptional 67.2% |
| Nepalese | 100.0 /100 | #32 | Exceptional 67.2% |
| Salvadorans | 100.0 /100 | #33 | Exceptional 67.2% |
| Thais | 100.0 /100 | #34 | Exceptional 67.2% |
| Tohono O'odham | 100.0 /100 | #35 | Exceptional 67.1% |
| Peruvians | 100.0 /100 | #36 | Exceptional 67.1% |
| Tsimshian | 100.0 /100 | #37 | Exceptional 67.1% |
| Mexican American Indians | 100.0 /100 | #38 | Exceptional 67.0% |
| Immigrants | El Salvador | 100.0 /100 | #39 | Exceptional 67.0% |
| Guamanians/Chamorros | 100.0 /100 | #40 | Exceptional 66.6% |
| Immigrants | Bolivia | 100.0 /100 | #41 | Exceptional 66.6% |
| Menominee | 100.0 /100 | #42 | Exceptional 66.5% |
| Apache | 100.0 /100 | #43 | Exceptional 66.5% |
| Asians | 100.0 /100 | #44 | Exceptional 66.5% |
Demographics Similar to Dutch West Indians by Family Households
In terms of family households, the demographic groups most similar to Dutch West Indians are Ute (64.3%, a difference of 0.010%), Immigrants from Sierra Leone (64.3%, a difference of 0.020%), Iraqi (64.4%, a difference of 0.030%), Armenian (64.4%, a difference of 0.030%), and Irish (64.4%, a difference of 0.050%).
| Demographics | Rating | Rank | Family Households |
| Immigrants | Southern Europe | 60.0 /100 | #165 | Good 64.4% |
| Scotch-Irish | 59.2 /100 | #166 | Average 64.4% |
| Irish | 57.9 /100 | #167 | Average 64.4% |
| Hondurans | 57.5 /100 | #168 | Average 64.4% |
| Iraqis | 56.0 /100 | #169 | Average 64.4% |
| Armenians | 55.9 /100 | #170 | Average 64.4% |
| Ute | 54.6 /100 | #171 | Average 64.3% |
| Dutch West Indians | 53.9 /100 | #172 | Average 64.3% |
| Immigrants | Sierra Leone | 52.5 /100 | #173 | Average 64.3% |
| Immigrants | Germany | 50.0 /100 | #174 | Average 64.3% |
| Bangladeshis | 44.3 /100 | #175 | Average 64.3% |
| Vietnamese | 43.6 /100 | #176 | Average 64.2% |
| Immigrants | Micronesia | 42.3 /100 | #177 | Average 64.2% |
| Jamaicans | 40.6 /100 | #178 | Average 64.2% |
| Immigrants | Ukraine | 38.2 /100 | #179 | Fair 64.2% |