Trinidadian and Tobagonian vs Immigrants from St. Vincent and the Grenadines Child Poverty Under the Age of 16
COMPARE
Trinidadian and Tobagonian
Immigrants from St. Vincent and the Grenadines
Child Poverty Under the Age of 16
Child Poverty Under the Age of 16 Comparison
Trinidadians and Tobagonians
Immigrants from St. Vincent and the Grenadines
19.2%
CHILD POVERTY UNDER THE AGE OF 16
0.2/ 100
METRIC RATING
255th/ 347
METRIC RANK
20.1%
CHILD POVERTY UNDER THE AGE OF 16
0.0/ 100
METRIC RATING
285th/ 347
METRIC RANK
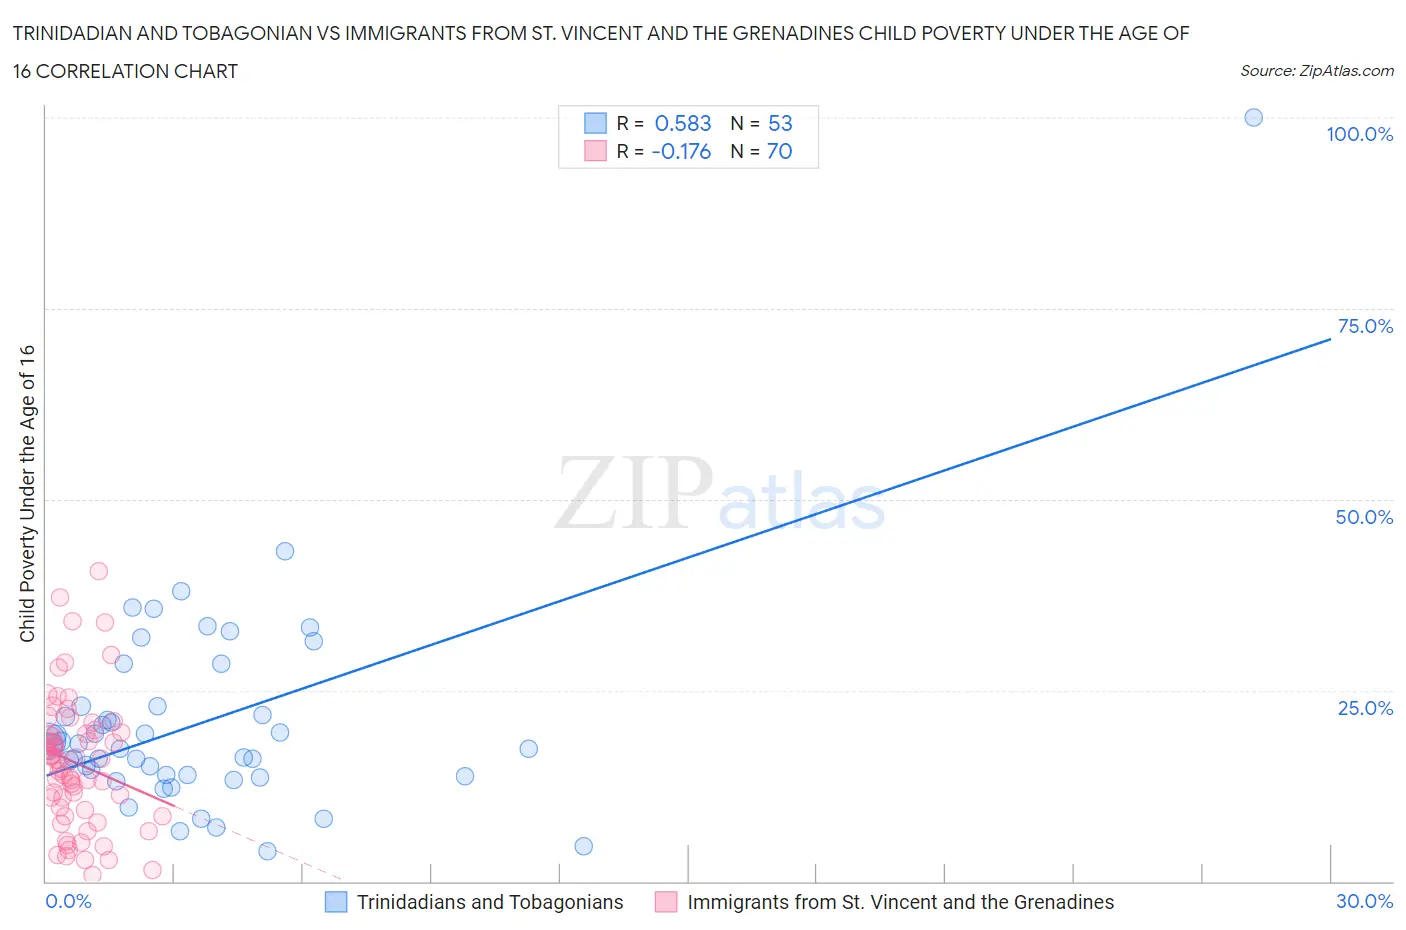
Trinidadian and Tobagonian vs Immigrants from St. Vincent and the Grenadines Child Poverty Under the Age of 16 Correlation Chart
The statistical analysis conducted on geographies consisting of 218,888,233 people shows a substantial positive correlation between the proportion of Trinidadians and Tobagonians and poverty level among children under the age of 16 in the United States with a correlation coefficient (R) of 0.583 and weighted average of 19.2%. Similarly, the statistical analysis conducted on geographies consisting of 56,141,906 people shows a poor negative correlation between the proportion of Immigrants from St. Vincent and the Grenadines and poverty level among children under the age of 16 in the United States with a correlation coefficient (R) of -0.176 and weighted average of 20.1%, a difference of 5.0%.
Child Poverty Under the Age of 16 Correlation Summary
| Measurement | Trinidadian and Tobagonian | Immigrants from St. Vincent and the Grenadines |
| Minimum | 4.0% | 0.78% |
| Maximum | 100.0% | 40.6% |
| Range | 96.0% | 39.9% |
| Mean | 20.8% | 15.5% |
| Median | 17.9% | 15.9% |
| Interquartile 25% (IQ1) | 13.8% | 9.4% |
| Interquartile 75% (IQ3) | 22.9% | 19.4% |
| Interquartile Range (IQR) | 9.1% | 10.0% |
| Standard Deviation (Sample) | 14.2% | 8.6% |
| Standard Deviation (Population) | 14.1% | 8.5% |
Similar Demographics by Child Poverty Under the Age of 16
Demographics Similar to Trinidadians and Tobagonians by Child Poverty Under the Age of 16
In terms of child poverty under the age of 16, the demographic groups most similar to Trinidadians and Tobagonians are Inupiat (19.2%, a difference of 0.090%), Ottawa (19.2%, a difference of 0.10%), Immigrants from Western Africa (19.2%, a difference of 0.17%), Spanish American (19.2%, a difference of 0.18%), and Salvadoran (19.1%, a difference of 0.42%).
| Demographics | Rating | Rank | Child Poverty Under the Age of 16 |
| Ecuadorians | 0.3 /100 | #248 | Tragic 19.0% |
| Potawatomi | 0.3 /100 | #249 | Tragic 19.0% |
| Immigrants | Middle Africa | 0.3 /100 | #250 | Tragic 19.0% |
| Immigrants | Ghana | 0.3 /100 | #251 | Tragic 19.1% |
| Immigrants | Trinidad and Tobago | 0.3 /100 | #252 | Tragic 19.1% |
| Salvadorans | 0.3 /100 | #253 | Tragic 19.1% |
| Immigrants | Western Africa | 0.2 /100 | #254 | Tragic 19.2% |
| Trinidadians and Tobagonians | 0.2 /100 | #255 | Tragic 19.2% |
| Inupiat | 0.2 /100 | #256 | Tragic 19.2% |
| Ottawa | 0.2 /100 | #257 | Tragic 19.2% |
| Spanish Americans | 0.2 /100 | #258 | Tragic 19.2% |
| Mexican American Indians | 0.2 /100 | #259 | Tragic 19.3% |
| Guyanese | 0.2 /100 | #260 | Tragic 19.3% |
| Immigrants | Burma/Myanmar | 0.1 /100 | #261 | Tragic 19.4% |
| Immigrants | Guyana | 0.1 /100 | #262 | Tragic 19.4% |
Demographics Similar to Immigrants from St. Vincent and the Grenadines by Child Poverty Under the Age of 16
In terms of child poverty under the age of 16, the demographic groups most similar to Immigrants from St. Vincent and the Grenadines are West Indian (20.1%, a difference of 0.060%), Immigrants from West Indies (20.2%, a difference of 0.14%), Immigrants from Zaire (20.1%, a difference of 0.21%), Blackfeet (20.2%, a difference of 0.26%), and Barbadian (20.0%, a difference of 0.43%).
| Demographics | Rating | Rank | Child Poverty Under the Age of 16 |
| Bangladeshis | 0.0 /100 | #278 | Tragic 19.9% |
| Sub-Saharan Africans | 0.0 /100 | #279 | Tragic 19.9% |
| Comanche | 0.0 /100 | #280 | Tragic 19.9% |
| Central Americans | 0.0 /100 | #281 | Tragic 20.0% |
| Barbadians | 0.0 /100 | #282 | Tragic 20.0% |
| Immigrants | Zaire | 0.0 /100 | #283 | Tragic 20.1% |
| West Indians | 0.0 /100 | #284 | Tragic 20.1% |
| Immigrants | St. Vincent and the Grenadines | 0.0 /100 | #285 | Tragic 20.1% |
| Immigrants | West Indies | 0.0 /100 | #286 | Tragic 20.2% |
| Blackfeet | 0.0 /100 | #287 | Tragic 20.2% |
| Immigrants | Belize | 0.0 /100 | #288 | Tragic 20.3% |
| Senegalese | 0.0 /100 | #289 | Tragic 20.4% |
| Yaqui | 0.0 /100 | #290 | Tragic 20.4% |
| Chippewa | 0.0 /100 | #291 | Tragic 20.5% |
| Immigrants | Latin America | 0.0 /100 | #292 | Tragic 20.5% |