Osage vs Immigrants from St. Vincent and the Grenadines Births to Unmarried Women
COMPARE
Osage
Immigrants from St. Vincent and the Grenadines
Births to Unmarried Women
Births to Unmarried Women Comparison
Osage
Immigrants from St. Vincent and the Grenadines
32.1%
BIRTHS TO UNMARRIED WOMEN
37.1/ 100
METRIC RATING
188th/ 347
METRIC RANK
37.3%
BIRTHS TO UNMARRIED WOMEN
0.1/ 100
METRIC RATING
280th/ 347
METRIC RANK
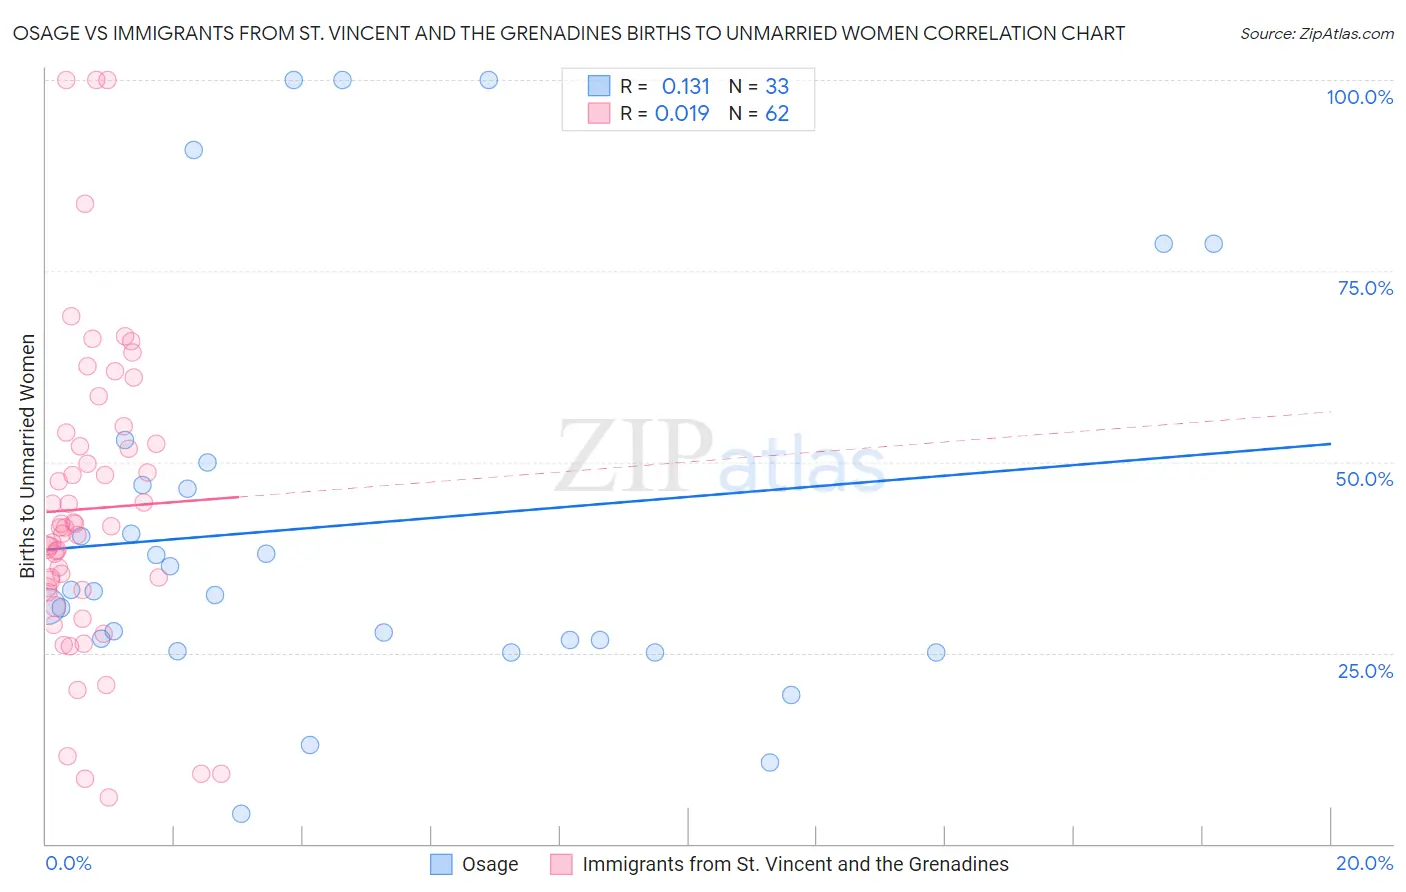
Osage vs Immigrants from St. Vincent and the Grenadines Births to Unmarried Women Correlation Chart
The statistical analysis conducted on geographies consisting of 89,866,368 people shows a poor positive correlation between the proportion of Osage and percentage of births to unmarried women in the United States with a correlation coefficient (R) of 0.131 and weighted average of 32.1%. Similarly, the statistical analysis conducted on geographies consisting of 55,457,752 people shows no correlation between the proportion of Immigrants from St. Vincent and the Grenadines and percentage of births to unmarried women in the United States with a correlation coefficient (R) of 0.019 and weighted average of 37.3%, a difference of 16.4%.
Births to Unmarried Women Correlation Summary
| Measurement | Osage | Immigrants from St. Vincent and the Grenadines |
| Minimum | 4.0% | 6.0% |
| Maximum | 100.0% | 100.0% |
| Range | 96.0% | 94.0% |
| Mean | 41.9% | 43.9% |
| Median | 33.0% | 41.5% |
| Interquartile 25% (IQ1) | 25.9% | 33.3% |
| Interquartile 75% (IQ3) | 48.4% | 52.4% |
| Interquartile Range (IQR) | 22.5% | 19.1% |
| Standard Deviation (Sample) | 26.2% | 20.4% |
| Standard Deviation (Population) | 25.8% | 20.2% |
Similar Demographics by Births to Unmarried Women
Demographics Similar to Osage by Births to Unmarried Women
In terms of births to unmarried women, the demographic groups most similar to Osage are Immigrants from Kenya (32.1%, a difference of 0.030%), Czechoslovakian (32.0%, a difference of 0.090%), Welsh (32.0%, a difference of 0.11%), German (32.0%, a difference of 0.23%), and Immigrants from South America (32.0%, a difference of 0.35%).
| Demographics | Rating | Rank | Births to Unmarried Women |
| Immigrants | Peru | 45.1 /100 | #181 | Average 31.8% |
| Kenyans | 43.0 /100 | #182 | Average 31.9% |
| Canadians | 41.4 /100 | #183 | Average 31.9% |
| Immigrants | South America | 40.7 /100 | #184 | Average 32.0% |
| Germans | 39.5 /100 | #185 | Fair 32.0% |
| Welsh | 38.2 /100 | #186 | Fair 32.0% |
| Czechoslovakians | 38.0 /100 | #187 | Fair 32.0% |
| Osage | 37.1 /100 | #188 | Fair 32.1% |
| Immigrants | Kenya | 36.9 /100 | #189 | Fair 32.1% |
| Tlingit-Haida | 32.6 /100 | #190 | Fair 32.2% |
| Irish | 32.4 /100 | #191 | Fair 32.2% |
| Colombians | 31.9 /100 | #192 | Fair 32.2% |
| Fijians | 31.1 /100 | #193 | Fair 32.3% |
| Sudanese | 27.3 /100 | #194 | Fair 32.4% |
| Samoans | 21.9 /100 | #195 | Fair 32.6% |
Demographics Similar to Immigrants from St. Vincent and the Grenadines by Births to Unmarried Women
In terms of births to unmarried women, the demographic groups most similar to Immigrants from St. Vincent and the Grenadines are Immigrants from Belize (37.3%, a difference of 0.020%), West Indian (37.3%, a difference of 0.12%), Liberian (37.4%, a difference of 0.18%), Spanish American Indian (37.4%, a difference of 0.26%), and Immigrants from Central America (37.4%, a difference of 0.33%).
| Demographics | Rating | Rank | Births to Unmarried Women |
| Mexicans | 0.1 /100 | #273 | Tragic 36.9% |
| Cree | 0.1 /100 | #274 | Tragic 37.0% |
| Barbadians | 0.1 /100 | #275 | Tragic 37.0% |
| Belizeans | 0.1 /100 | #276 | Tragic 37.0% |
| Guatemalans | 0.1 /100 | #277 | Tragic 37.1% |
| Immigrants | Latin America | 0.1 /100 | #278 | Tragic 37.1% |
| West Indians | 0.1 /100 | #279 | Tragic 37.3% |
| Immigrants | St. Vincent and the Grenadines | 0.1 /100 | #280 | Tragic 37.3% |
| Immigrants | Belize | 0.1 /100 | #281 | Tragic 37.3% |
| Liberians | 0.0 /100 | #282 | Tragic 37.4% |
| Spanish American Indians | 0.0 /100 | #283 | Tragic 37.4% |
| Immigrants | Central America | 0.0 /100 | #284 | Tragic 37.4% |
| Immigrants | Mexico | 0.0 /100 | #285 | Tragic 37.5% |
| Immigrants | Guatemala | 0.0 /100 | #286 | Tragic 37.5% |
| Creek | 0.0 /100 | #287 | Tragic 37.6% |