Sierra Leonean vs Immigrants from Scotland Births to Unmarried Women
COMPARE
Sierra Leonean
Immigrants from Scotland
Births to Unmarried Women
Births to Unmarried Women Comparison
Sierra Leoneans
Immigrants from Scotland
34.9%
BIRTHS TO UNMARRIED WOMEN
1.4/ 100
METRIC RATING
239th/ 347
METRIC RANK
30.4%
BIRTHS TO UNMARRIED WOMEN
84.6/ 100
METRIC RATING
136th/ 347
METRIC RANK
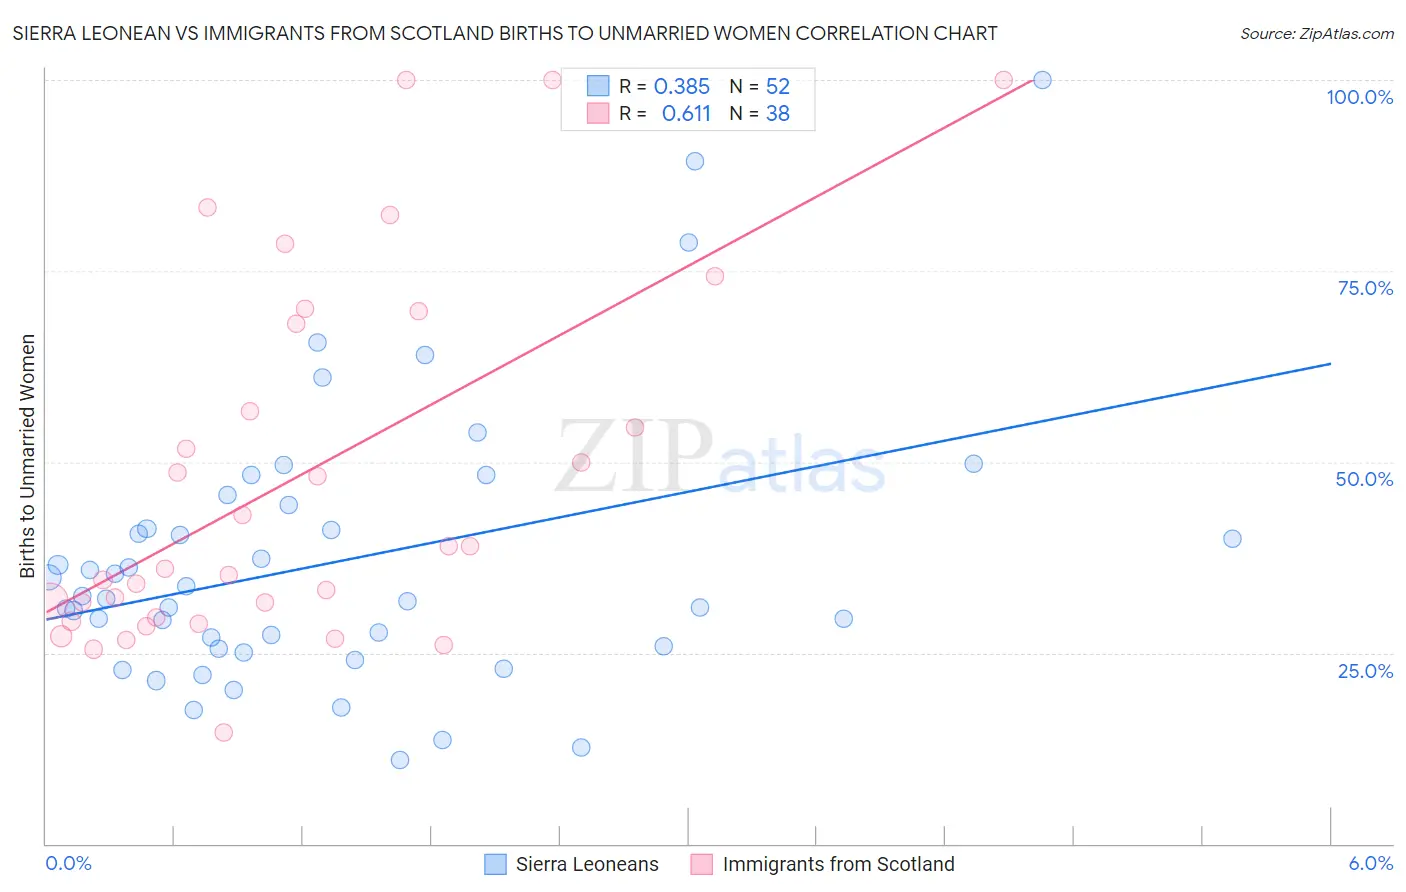
Sierra Leonean vs Immigrants from Scotland Births to Unmarried Women Correlation Chart
The statistical analysis conducted on geographies consisting of 82,118,430 people shows a mild positive correlation between the proportion of Sierra Leoneans and percentage of births to unmarried women in the United States with a correlation coefficient (R) of 0.385 and weighted average of 34.9%. Similarly, the statistical analysis conducted on geographies consisting of 185,682,115 people shows a significant positive correlation between the proportion of Immigrants from Scotland and percentage of births to unmarried women in the United States with a correlation coefficient (R) of 0.611 and weighted average of 30.4%, a difference of 14.7%.
Births to Unmarried Women Correlation Summary
| Measurement | Sierra Leonean | Immigrants from Scotland |
| Minimum | 11.0% | 14.6% |
| Maximum | 100.0% | 100.0% |
| Range | 89.0% | 85.4% |
| Mean | 37.0% | 47.9% |
| Median | 32.2% | 37.5% |
| Interquartile 25% (IQ1) | 25.7% | 29.6% |
| Interquartile 75% (IQ3) | 42.9% | 68.2% |
| Interquartile Range (IQR) | 17.1% | 38.6% |
| Standard Deviation (Sample) | 18.0% | 23.6% |
| Standard Deviation (Population) | 17.9% | 23.3% |
Similar Demographics by Births to Unmarried Women
Demographics Similar to Sierra Leoneans by Births to Unmarried Women
In terms of births to unmarried women, the demographic groups most similar to Sierra Leoneans are Immigrants from Cambodia (34.8%, a difference of 0.22%), Immigrants from Middle Africa (34.9%, a difference of 0.25%), Marshallese (34.8%, a difference of 0.28%), Immigrants from Guyana (35.0%, a difference of 0.28%), and Immigrants from Cameroon (34.7%, a difference of 0.36%).
| Demographics | Rating | Rank | Births to Unmarried Women |
| French Canadians | 2.5 /100 | #232 | Tragic 34.4% |
| Bangladeshis | 2.5 /100 | #233 | Tragic 34.4% |
| Immigrants | Zaire | 2.3 /100 | #234 | Tragic 34.5% |
| Immigrants | Ghana | 2.2 /100 | #235 | Tragic 34.5% |
| Immigrants | Cameroon | 1.6 /100 | #236 | Tragic 34.7% |
| Marshallese | 1.6 /100 | #237 | Tragic 34.8% |
| Immigrants | Cambodia | 1.6 /100 | #238 | Tragic 34.8% |
| Sierra Leoneans | 1.4 /100 | #239 | Tragic 34.9% |
| Immigrants | Middle Africa | 1.2 /100 | #240 | Tragic 34.9% |
| Immigrants | Guyana | 1.2 /100 | #241 | Tragic 35.0% |
| Indonesians | 1.2 /100 | #242 | Tragic 35.0% |
| Japanese | 0.9 /100 | #243 | Tragic 35.2% |
| Guyanese | 0.9 /100 | #244 | Tragic 35.2% |
| Shoshone | 0.8 /100 | #245 | Tragic 35.3% |
| Nigerians | 0.7 /100 | #246 | Tragic 35.3% |
Demographics Similar to Immigrants from Scotland by Births to Unmarried Women
In terms of births to unmarried women, the demographic groups most similar to Immigrants from Scotland are Brazilian (30.4%, a difference of 0.030%), Immigrants from South Eastern Asia (30.4%, a difference of 0.11%), Immigrants from Morocco (30.4%, a difference of 0.12%), Immigrants from Philippines (30.4%, a difference of 0.13%), and Puget Sound Salish (30.4%, a difference of 0.13%).
| Demographics | Rating | Rank | Births to Unmarried Women |
| Immigrants | Spain | 85.8 /100 | #129 | Excellent 30.3% |
| Immigrants | Bosnia and Herzegovina | 85.7 /100 | #130 | Excellent 30.3% |
| Immigrants | Zimbabwe | 85.7 /100 | #131 | Excellent 30.3% |
| New Zealanders | 85.5 /100 | #132 | Excellent 30.3% |
| Immigrants | Morocco | 85.2 /100 | #133 | Excellent 30.4% |
| Immigrants | South Eastern Asia | 85.2 /100 | #134 | Excellent 30.4% |
| Brazilians | 84.8 /100 | #135 | Excellent 30.4% |
| Immigrants | Scotland | 84.6 /100 | #136 | Excellent 30.4% |
| Immigrants | Philippines | 83.9 /100 | #137 | Excellent 30.4% |
| Puget Sound Salish | 83.9 /100 | #138 | Excellent 30.4% |
| Immigrants | Canada | 83.7 /100 | #139 | Excellent 30.4% |
| Swiss | 83.1 /100 | #140 | Excellent 30.5% |
| Pakistanis | 83.0 /100 | #141 | Excellent 30.5% |
| South Africans | 82.7 /100 | #142 | Excellent 30.5% |
| Immigrants | Uganda | 82.6 /100 | #143 | Excellent 30.5% |