Trinidadian and Tobagonian vs Immigrants from Serbia Family Households with Children
COMPARE
Trinidadian and Tobagonian
Immigrants from Serbia
Family Households with Children
Family Households with Children Comparison
Trinidadians and Tobagonians
Immigrants from Serbia
26.4%
FAMILY HOUSEHOLDS WITH CHILDREN
0.1/ 100
METRIC RATING
299th/ 347
METRIC RANK
25.5%
FAMILY HOUSEHOLDS WITH CHILDREN
0.0/ 100
METRIC RATING
341st/ 347
METRIC RANK
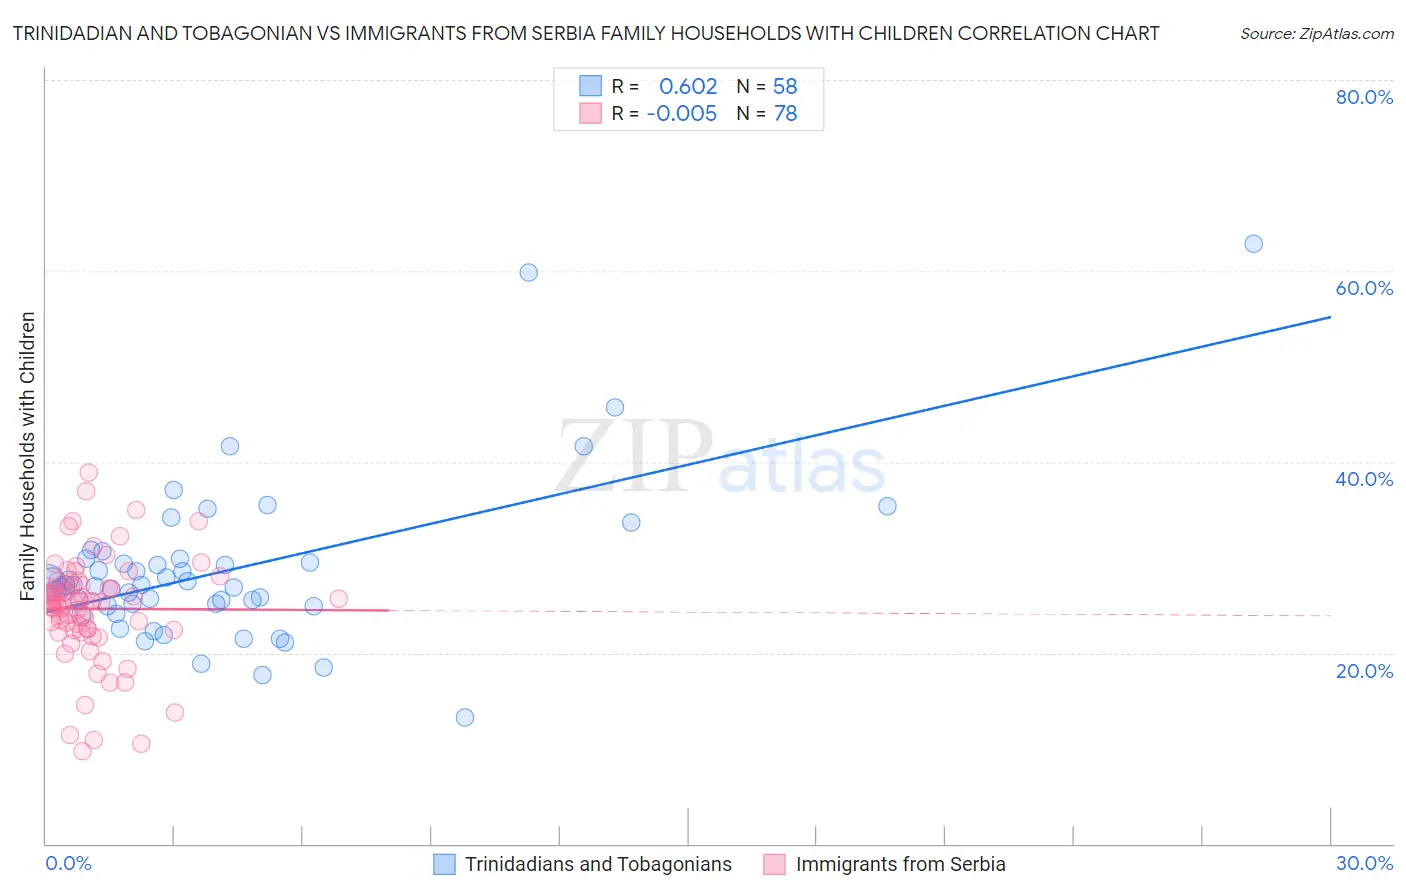
Trinidadian and Tobagonian vs Immigrants from Serbia Family Households with Children Correlation Chart
The statistical analysis conducted on geographies consisting of 219,664,488 people shows a significant positive correlation between the proportion of Trinidadians and Tobagonians and percentage of family households with children in the United States with a correlation coefficient (R) of 0.602 and weighted average of 26.4%. Similarly, the statistical analysis conducted on geographies consisting of 131,676,754 people shows no correlation between the proportion of Immigrants from Serbia and percentage of family households with children in the United States with a correlation coefficient (R) of -0.005 and weighted average of 25.5%, a difference of 3.7%.
Family Households with Children Correlation Summary
| Measurement | Trinidadian and Tobagonian | Immigrants from Serbia |
| Minimum | 13.3% | 9.7% |
| Maximum | 62.8% | 38.8% |
| Range | 49.5% | 29.1% |
| Mean | 28.7% | 24.6% |
| Median | 27.1% | 25.3% |
| Interquartile 25% (IQ1) | 24.9% | 22.4% |
| Interquartile 75% (IQ3) | 29.8% | 27.1% |
| Interquartile Range (IQR) | 4.9% | 4.7% |
| Standard Deviation (Sample) | 8.5% | 5.6% |
| Standard Deviation (Population) | 8.4% | 5.5% |
Similar Demographics by Family Households with Children
Demographics Similar to Trinidadians and Tobagonians by Family Households with Children
In terms of family households with children, the demographic groups most similar to Trinidadians and Tobagonians are Immigrants from Western Europe (26.4%, a difference of 0.010%), Armenian (26.4%, a difference of 0.11%), Croatian (26.4%, a difference of 0.12%), Paiute (26.4%, a difference of 0.12%), and Macedonian (26.4%, a difference of 0.14%).
| Demographics | Rating | Rank | Family Households with Children |
| Poles | 0.2 /100 | #292 | Tragic 26.5% |
| Blacks/African Americans | 0.1 /100 | #293 | Tragic 26.5% |
| Latvians | 0.1 /100 | #294 | Tragic 26.4% |
| Macedonians | 0.1 /100 | #295 | Tragic 26.4% |
| Croatians | 0.1 /100 | #296 | Tragic 26.4% |
| Armenians | 0.1 /100 | #297 | Tragic 26.4% |
| Immigrants | Western Europe | 0.1 /100 | #298 | Tragic 26.4% |
| Trinidadians and Tobagonians | 0.1 /100 | #299 | Tragic 26.4% |
| Paiute | 0.1 /100 | #300 | Tragic 26.4% |
| Immigrants | Trinidad and Tobago | 0.1 /100 | #301 | Tragic 26.4% |
| Serbians | 0.1 /100 | #302 | Tragic 26.4% |
| Immigrants | Guyana | 0.1 /100 | #303 | Tragic 26.3% |
| Immigrants | Bahamas | 0.1 /100 | #304 | Tragic 26.3% |
| Guyanese | 0.1 /100 | #305 | Tragic 26.3% |
| Bermudans | 0.1 /100 | #306 | Tragic 26.3% |
Demographics Similar to Immigrants from Serbia by Family Households with Children
In terms of family households with children, the demographic groups most similar to Immigrants from Serbia are Immigrants from Armenia (25.6%, a difference of 0.38%), Immigrants from St. Vincent and the Grenadines (25.6%, a difference of 0.42%), Arapaho (25.6%, a difference of 0.43%), Puerto Rican (25.6%, a difference of 0.46%), and Alsatian (25.3%, a difference of 0.68%).
| Demographics | Rating | Rank | Family Households with Children |
| Immigrants | Switzerland | 0.0 /100 | #333 | Tragic 25.7% |
| Slovaks | 0.0 /100 | #334 | Tragic 25.7% |
| Immigrants | Croatia | 0.0 /100 | #335 | Tragic 25.7% |
| Immigrants | West Indies | 0.0 /100 | #336 | Tragic 25.7% |
| Puerto Ricans | 0.0 /100 | #337 | Tragic 25.6% |
| Arapaho | 0.0 /100 | #338 | Tragic 25.6% |
| Immigrants | St. Vincent and the Grenadines | 0.0 /100 | #339 | Tragic 25.6% |
| Immigrants | Armenia | 0.0 /100 | #340 | Tragic 25.6% |
| Immigrants | Serbia | 0.0 /100 | #341 | Tragic 25.5% |
| Alsatians | 0.0 /100 | #342 | Tragic 25.3% |
| Hopi | 0.0 /100 | #343 | Tragic 25.2% |
| Pueblo | 0.0 /100 | #344 | Tragic 25.2% |
| Immigrants | Grenada | 0.0 /100 | #345 | Tragic 25.2% |
| Carpatho Rusyns | 0.0 /100 | #346 | Tragic 25.2% |
| Soviet Union | 0.0 /100 | #347 | Tragic 24.8% |