Cypriot vs Immigrants from Laos Family Households with Children
COMPARE
Cypriot
Immigrants from Laos
Family Households with Children
Family Households with Children Comparison
Cypriots
Immigrants from Laos
25.9%
FAMILY HOUSEHOLDS WITH CHILDREN
0.0/ 100
METRIC RATING
329th/ 347
METRIC RANK
29.8%
FAMILY HOUSEHOLDS WITH CHILDREN
100.0/ 100
METRIC RATING
21st/ 347
METRIC RANK
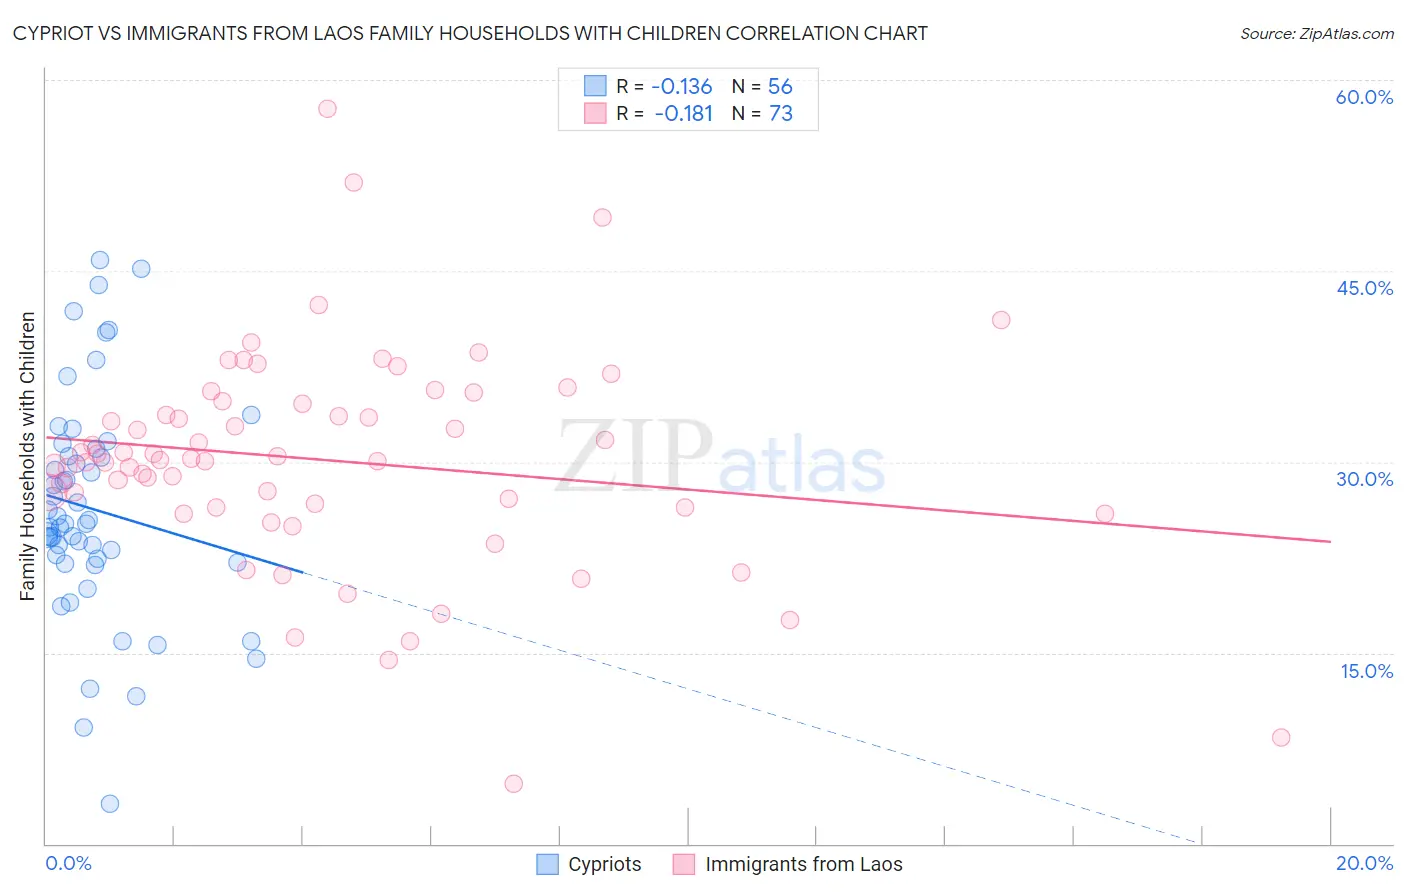
Cypriot vs Immigrants from Laos Family Households with Children Correlation Chart
The statistical analysis conducted on geographies consisting of 61,838,668 people shows a poor negative correlation between the proportion of Cypriots and percentage of family households with children in the United States with a correlation coefficient (R) of -0.136 and weighted average of 25.9%. Similarly, the statistical analysis conducted on geographies consisting of 201,433,217 people shows a poor negative correlation between the proportion of Immigrants from Laos and percentage of family households with children in the United States with a correlation coefficient (R) of -0.181 and weighted average of 29.8%, a difference of 15.2%.
Family Households with Children Correlation Summary
| Measurement | Cypriot | Immigrants from Laos |
| Minimum | 3.1% | 4.8% |
| Maximum | 45.8% | 57.7% |
| Range | 42.7% | 53.0% |
| Mean | 26.3% | 30.1% |
| Median | 25.1% | 30.1% |
| Interquartile 25% (IQ1) | 22.3% | 26.4% |
| Interquartile 75% (IQ3) | 30.8% | 34.6% |
| Interquartile Range (IQR) | 8.5% | 8.2% |
| Standard Deviation (Sample) | 8.8% | 8.6% |
| Standard Deviation (Population) | 8.7% | 8.5% |
Similar Demographics by Family Households with Children
Demographics Similar to Cypriots by Family Households with Children
In terms of family households with children, the demographic groups most similar to Cypriots are Immigrants from Albania (25.9%, a difference of 0.13%), Immigrants from Latvia (25.9%, a difference of 0.18%), Immigrants from Barbados (26.0%, a difference of 0.23%), Slovene (25.8%, a difference of 0.31%), and Immigrants from Ireland (26.0%, a difference of 0.33%).
| Demographics | Rating | Rank | Family Households with Children |
| Immigrants | Greece | 0.0 /100 | #322 | Tragic 26.0% |
| Immigrants | Australia | 0.0 /100 | #323 | Tragic 26.0% |
| Chinese | 0.0 /100 | #324 | Tragic 26.0% |
| Barbadians | 0.0 /100 | #325 | Tragic 26.0% |
| Immigrants | Ireland | 0.0 /100 | #326 | Tragic 26.0% |
| Immigrants | Barbados | 0.0 /100 | #327 | Tragic 26.0% |
| Immigrants | Albania | 0.0 /100 | #328 | Tragic 25.9% |
| Cypriots | 0.0 /100 | #329 | Tragic 25.9% |
| Immigrants | Latvia | 0.0 /100 | #330 | Tragic 25.9% |
| Slovenes | 0.0 /100 | #331 | Tragic 25.8% |
| Immigrants | Austria | 0.0 /100 | #332 | Tragic 25.8% |
| Immigrants | Switzerland | 0.0 /100 | #333 | Tragic 25.7% |
| Slovaks | 0.0 /100 | #334 | Tragic 25.7% |
| Immigrants | Croatia | 0.0 /100 | #335 | Tragic 25.7% |
| Immigrants | West Indies | 0.0 /100 | #336 | Tragic 25.7% |
Demographics Similar to Immigrants from Laos by Family Households with Children
In terms of family households with children, the demographic groups most similar to Immigrants from Laos are Malaysian (29.8%, a difference of 0.030%), Immigrants from El Salvador (29.8%, a difference of 0.040%), Alaska Native (29.9%, a difference of 0.070%), Salvadoran (29.9%, a difference of 0.11%), and Hispanic or Latino (29.9%, a difference of 0.30%).
| Demographics | Rating | Rank | Family Households with Children |
| Bangladeshis | 100.0 /100 | #14 | Exceptional 30.1% |
| Immigrants | South Central Asia | 100.0 /100 | #15 | Exceptional 30.0% |
| Immigrants | Afghanistan | 100.0 /100 | #16 | Exceptional 30.0% |
| Hispanics or Latinos | 100.0 /100 | #17 | Exceptional 29.9% |
| Salvadorans | 100.0 /100 | #18 | Exceptional 29.9% |
| Alaska Natives | 100.0 /100 | #19 | Exceptional 29.9% |
| Immigrants | El Salvador | 100.0 /100 | #20 | Exceptional 29.8% |
| Immigrants | Laos | 100.0 /100 | #21 | Exceptional 29.8% |
| Malaysians | 100.0 /100 | #22 | Exceptional 29.8% |
| Mexican American Indians | 100.0 /100 | #23 | Exceptional 29.7% |
| Guamanians/Chamorros | 100.0 /100 | #24 | Exceptional 29.7% |
| Immigrants | Latin America | 100.0 /100 | #25 | Exceptional 29.7% |
| Sri Lankans | 100.0 /100 | #26 | Exceptional 29.5% |
| Immigrants | Vietnam | 100.0 /100 | #27 | Exceptional 29.5% |
| Samoans | 100.0 /100 | #28 | Exceptional 29.5% |