Trinidadian and Tobagonian vs Colombian Family Households with Children
COMPARE
Trinidadian and Tobagonian
Colombian
Family Households with Children
Family Households with Children Comparison
Trinidadians and Tobagonians
Colombians
26.4%
FAMILY HOUSEHOLDS WITH CHILDREN
0.1/ 100
METRIC RATING
299th/ 347
METRIC RANK
28.3%
FAMILY HOUSEHOLDS WITH CHILDREN
99.6/ 100
METRIC RATING
87th/ 347
METRIC RANK
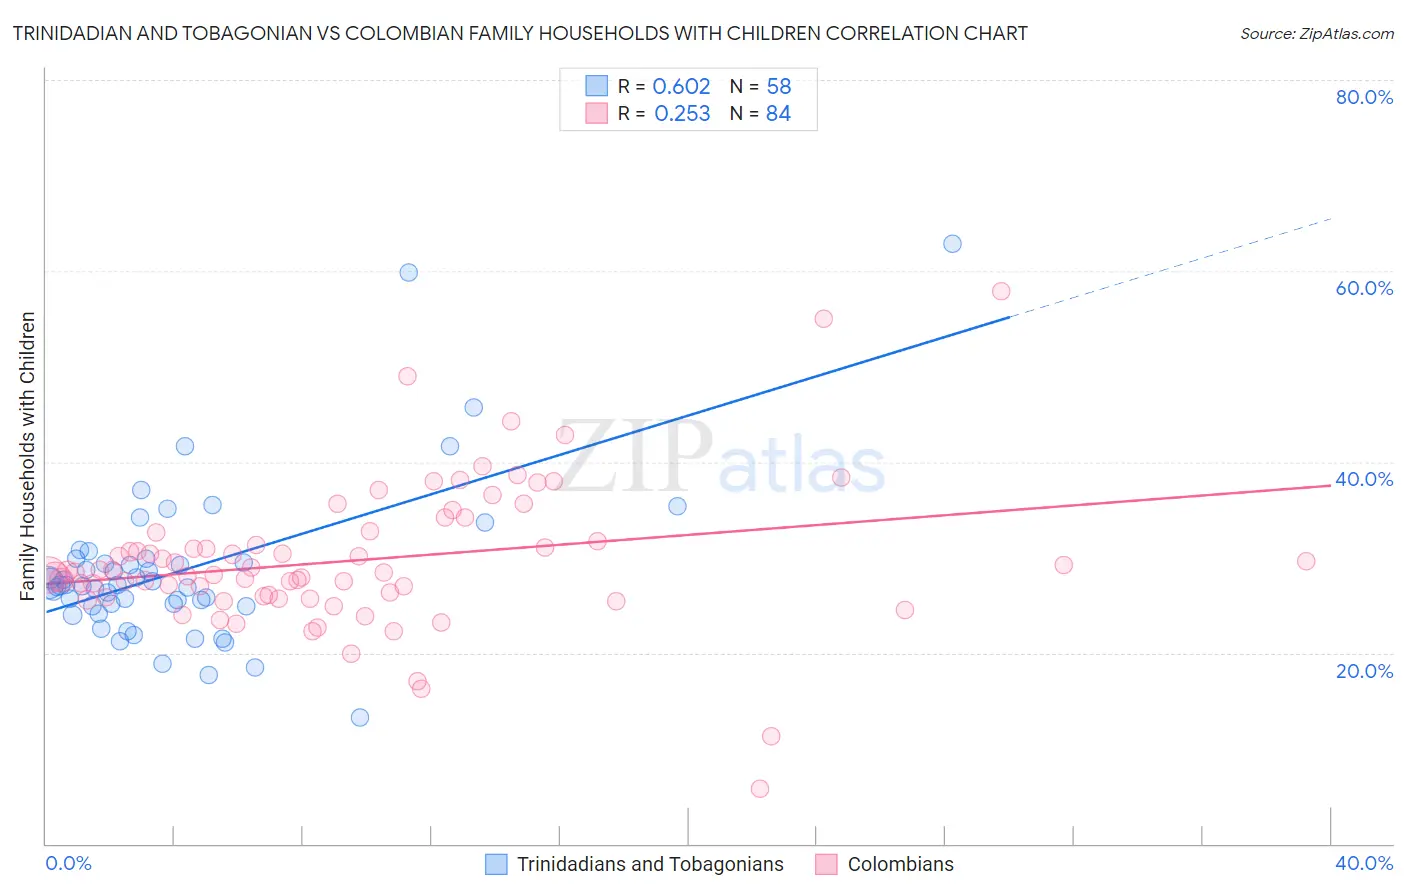
Trinidadian and Tobagonian vs Colombian Family Households with Children Correlation Chart
The statistical analysis conducted on geographies consisting of 219,664,488 people shows a significant positive correlation between the proportion of Trinidadians and Tobagonians and percentage of family households with children in the United States with a correlation coefficient (R) of 0.602 and weighted average of 26.4%. Similarly, the statistical analysis conducted on geographies consisting of 419,165,889 people shows a weak positive correlation between the proportion of Colombians and percentage of family households with children in the United States with a correlation coefficient (R) of 0.253 and weighted average of 28.3%, a difference of 7.1%.
Family Households with Children Correlation Summary
| Measurement | Trinidadian and Tobagonian | Colombian |
| Minimum | 13.3% | 5.7% |
| Maximum | 62.8% | 57.9% |
| Range | 49.5% | 52.2% |
| Mean | 28.7% | 29.7% |
| Median | 27.1% | 28.4% |
| Interquartile 25% (IQ1) | 24.9% | 25.9% |
| Interquartile 75% (IQ3) | 29.8% | 32.1% |
| Interquartile Range (IQR) | 4.9% | 6.3% |
| Standard Deviation (Sample) | 8.5% | 7.7% |
| Standard Deviation (Population) | 8.4% | 7.7% |
Similar Demographics by Family Households with Children
Demographics Similar to Trinidadians and Tobagonians by Family Households with Children
In terms of family households with children, the demographic groups most similar to Trinidadians and Tobagonians are Immigrants from Western Europe (26.4%, a difference of 0.010%), Armenian (26.4%, a difference of 0.11%), Croatian (26.4%, a difference of 0.12%), Paiute (26.4%, a difference of 0.12%), and Macedonian (26.4%, a difference of 0.14%).
| Demographics | Rating | Rank | Family Households with Children |
| Poles | 0.2 /100 | #292 | Tragic 26.5% |
| Blacks/African Americans | 0.1 /100 | #293 | Tragic 26.5% |
| Latvians | 0.1 /100 | #294 | Tragic 26.4% |
| Macedonians | 0.1 /100 | #295 | Tragic 26.4% |
| Croatians | 0.1 /100 | #296 | Tragic 26.4% |
| Armenians | 0.1 /100 | #297 | Tragic 26.4% |
| Immigrants | Western Europe | 0.1 /100 | #298 | Tragic 26.4% |
| Trinidadians and Tobagonians | 0.1 /100 | #299 | Tragic 26.4% |
| Paiute | 0.1 /100 | #300 | Tragic 26.4% |
| Immigrants | Trinidad and Tobago | 0.1 /100 | #301 | Tragic 26.4% |
| Serbians | 0.1 /100 | #302 | Tragic 26.4% |
| Immigrants | Guyana | 0.1 /100 | #303 | Tragic 26.3% |
| Immigrants | Bahamas | 0.1 /100 | #304 | Tragic 26.3% |
| Guyanese | 0.1 /100 | #305 | Tragic 26.3% |
| Bermudans | 0.1 /100 | #306 | Tragic 26.3% |
Demographics Similar to Colombians by Family Households with Children
In terms of family households with children, the demographic groups most similar to Colombians are Liberian (28.3%, a difference of 0.010%), Immigrants from Costa Rica (28.3%, a difference of 0.020%), Immigrants from Western Africa (28.3%, a difference of 0.060%), Immigrants from Thailand (28.2%, a difference of 0.13%), and Immigrants from Liberia (28.2%, a difference of 0.18%).
| Demographics | Rating | Rank | Family Households with Children |
| Natives/Alaskans | 99.8 /100 | #80 | Exceptional 28.4% |
| South Americans | 99.8 /100 | #81 | Exceptional 28.4% |
| Kenyans | 99.8 /100 | #82 | Exceptional 28.4% |
| Nicaraguans | 99.8 /100 | #83 | Exceptional 28.4% |
| Costa Ricans | 99.8 /100 | #84 | Exceptional 28.4% |
| Immigrants | Syria | 99.8 /100 | #85 | Exceptional 28.4% |
| Immigrants | Western Africa | 99.6 /100 | #86 | Exceptional 28.3% |
| Colombians | 99.6 /100 | #87 | Exceptional 28.3% |
| Liberians | 99.6 /100 | #88 | Exceptional 28.3% |
| Immigrants | Costa Rica | 99.6 /100 | #89 | Exceptional 28.3% |
| Immigrants | Thailand | 99.5 /100 | #90 | Exceptional 28.2% |
| Immigrants | Liberia | 99.4 /100 | #91 | Exceptional 28.2% |
| Chickasaw | 99.4 /100 | #92 | Exceptional 28.2% |
| Panamanians | 99.3 /100 | #93 | Exceptional 28.2% |
| Immigrants | Colombia | 99.2 /100 | #94 | Exceptional 28.2% |