Immigrants from Ghana vs Immigrants from Senegal Single Mother Households
COMPARE
Immigrants from Ghana
Immigrants from Senegal
Single Mother Households
Single Mother Households Comparison
Immigrants from Ghana
Immigrants from Senegal
8.0%
SINGLE MOTHER HOUSEHOLDS
0.0/ 100
METRIC RATING
302nd/ 347
METRIC RANK
8.3%
SINGLE MOTHER HOUSEHOLDS
0.0/ 100
METRIC RATING
321st/ 347
METRIC RANK
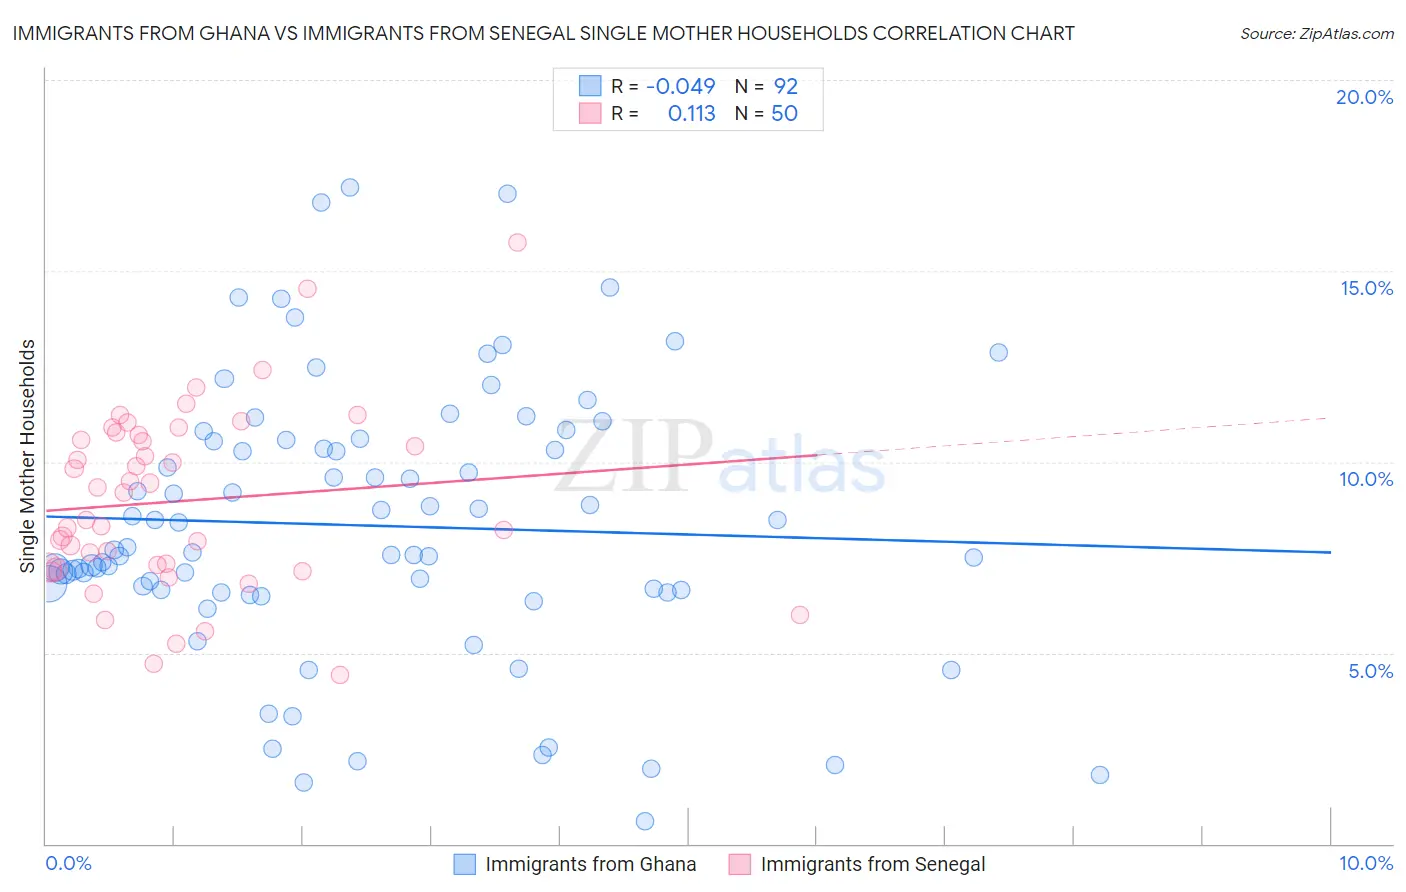
Immigrants from Ghana vs Immigrants from Senegal Single Mother Households Correlation Chart
The statistical analysis conducted on geographies consisting of 199,625,094 people shows no correlation between the proportion of Immigrants from Ghana and percentage of single mother households in the United States with a correlation coefficient (R) of -0.049 and weighted average of 8.0%. Similarly, the statistical analysis conducted on geographies consisting of 90,052,902 people shows a poor positive correlation between the proportion of Immigrants from Senegal and percentage of single mother households in the United States with a correlation coefficient (R) of 0.113 and weighted average of 8.3%, a difference of 3.6%.
Single Mother Households Correlation Summary
| Measurement | Immigrants from Ghana | Immigrants from Senegal |
| Minimum | 0.60% | 4.4% |
| Maximum | 17.2% | 15.7% |
| Range | 16.6% | 11.3% |
| Mean | 8.3% | 9.0% |
| Median | 7.7% | 8.8% |
| Interquartile 25% (IQ1) | 6.6% | 7.2% |
| Interquartile 75% (IQ3) | 10.6% | 10.7% |
| Interquartile Range (IQR) | 3.9% | 3.5% |
| Standard Deviation (Sample) | 3.5% | 2.4% |
| Standard Deviation (Population) | 3.5% | 2.3% |
Demographics Similar to Immigrants from Ghana and Immigrants from Senegal by Single Mother Households
In terms of single mother households, the demographic groups most similar to Immigrants from Ghana are Immigrants from Bahamas (8.0%, a difference of 0.020%), Chippewa (8.0%, a difference of 0.10%), Native/Alaskan (8.0%, a difference of 0.46%), Colville (8.0%, a difference of 0.51%), and Immigrants from Barbados (8.0%, a difference of 0.58%). Similarly, the demographic groups most similar to Immigrants from Senegal are Bahamian (8.3%, a difference of 0.24%), Jamaican (8.2%, a difference of 0.36%), Senegalese (8.2%, a difference of 0.47%), Immigrants from Honduras (8.2%, a difference of 1.0%), and African (8.2%, a difference of 1.2%).
| Demographics | Rating | Rank | Single Mother Households |
| Chippewa | 0.0 /100 | #301 | Tragic 8.0% |
| Immigrants | Ghana | 0.0 /100 | #302 | Tragic 8.0% |
| Immigrants | Bahamas | 0.0 /100 | #303 | Tragic 8.0% |
| Natives/Alaskans | 0.0 /100 | #304 | Tragic 8.0% |
| Colville | 0.0 /100 | #305 | Tragic 8.0% |
| Immigrants | Barbados | 0.0 /100 | #306 | Tragic 8.0% |
| Immigrants | St. Vincent and the Grenadines | 0.0 /100 | #307 | Tragic 8.0% |
| Immigrants | Central America | 0.0 /100 | #308 | Tragic 8.1% |
| Cheyenne | 0.0 /100 | #309 | Tragic 8.1% |
| Hondurans | 0.0 /100 | #310 | Tragic 8.1% |
| Immigrants | Congo | 0.0 /100 | #311 | Tragic 8.1% |
| Bangladeshis | 0.0 /100 | #312 | Tragic 8.1% |
| Immigrants | Grenada | 0.0 /100 | #313 | Tragic 8.2% |
| Immigrants | Mexico | 0.0 /100 | #314 | Tragic 8.2% |
| Immigrants | Western Africa | 0.0 /100 | #315 | Tragic 8.2% |
| Africans | 0.0 /100 | #316 | Tragic 8.2% |
| Immigrants | Honduras | 0.0 /100 | #317 | Tragic 8.2% |
| Senegalese | 0.0 /100 | #318 | Tragic 8.2% |
| Jamaicans | 0.0 /100 | #319 | Tragic 8.2% |
| Bahamians | 0.0 /100 | #320 | Tragic 8.3% |
| Immigrants | Senegal | 0.0 /100 | #321 | Tragic 8.3% |