Carpatho Rusyn vs Immigrants from Senegal Single Mother Households
COMPARE
Carpatho Rusyn
Immigrants from Senegal
Single Mother Households
Single Mother Households Comparison
Carpatho Rusyns
Immigrants from Senegal
5.7%
SINGLE MOTHER HOUSEHOLDS
97.7/ 100
METRIC RATING
84th/ 347
METRIC RANK
8.3%
SINGLE MOTHER HOUSEHOLDS
0.0/ 100
METRIC RATING
321st/ 347
METRIC RANK
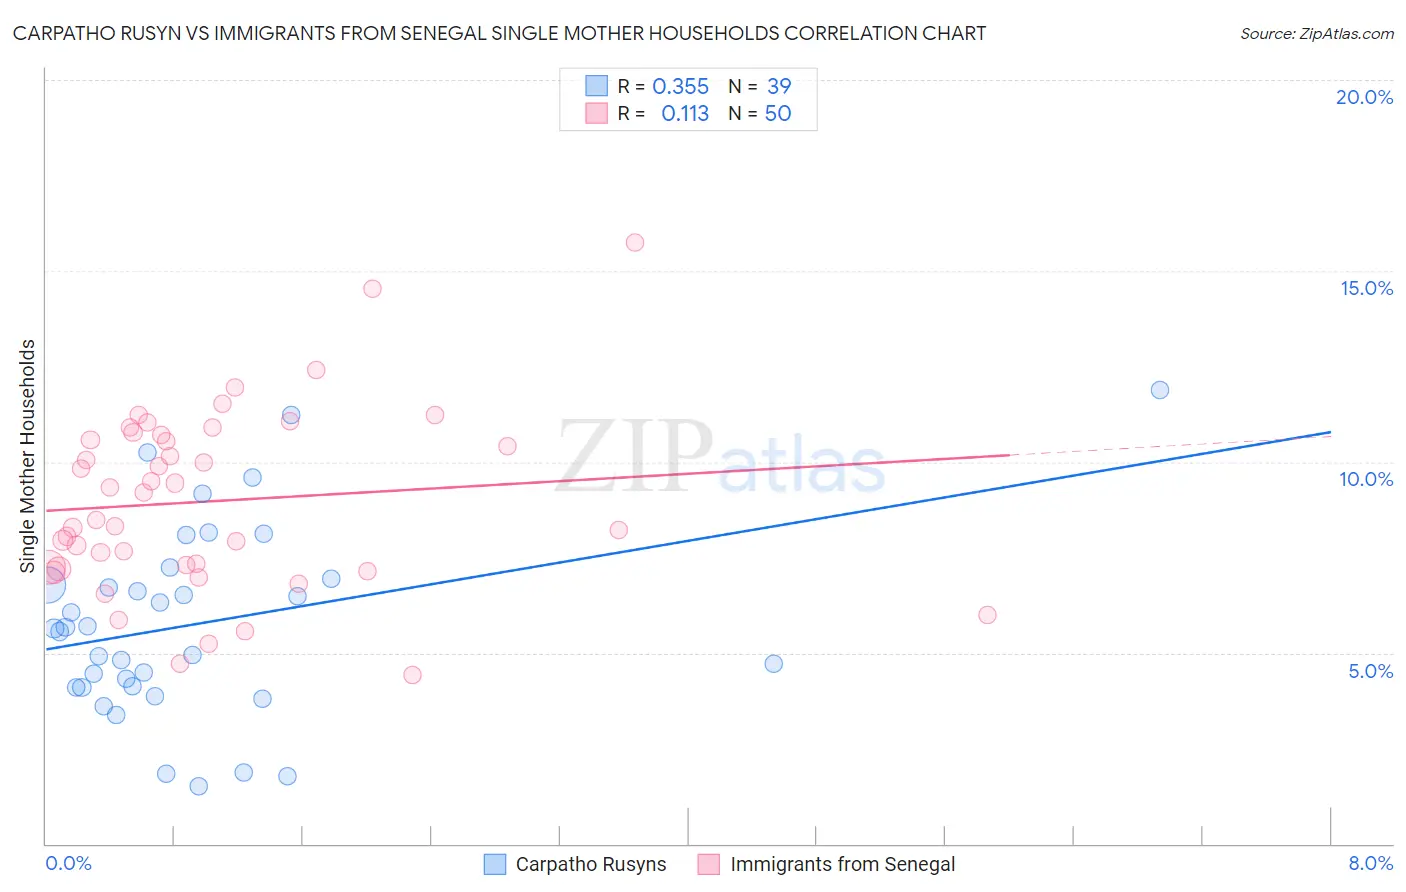
Carpatho Rusyn vs Immigrants from Senegal Single Mother Households Correlation Chart
The statistical analysis conducted on geographies consisting of 58,858,752 people shows a mild positive correlation between the proportion of Carpatho Rusyns and percentage of single mother households in the United States with a correlation coefficient (R) of 0.355 and weighted average of 5.7%. Similarly, the statistical analysis conducted on geographies consisting of 90,052,902 people shows a poor positive correlation between the proportion of Immigrants from Senegal and percentage of single mother households in the United States with a correlation coefficient (R) of 0.113 and weighted average of 8.3%, a difference of 46.1%.
Single Mother Households Correlation Summary
| Measurement | Carpatho Rusyn | Immigrants from Senegal |
| Minimum | 1.5% | 4.4% |
| Maximum | 11.9% | 15.7% |
| Range | 10.4% | 11.3% |
| Mean | 5.8% | 9.0% |
| Median | 5.6% | 8.8% |
| Interquartile 25% (IQ1) | 4.1% | 7.2% |
| Interquartile 75% (IQ3) | 6.9% | 10.7% |
| Interquartile Range (IQR) | 2.8% | 3.5% |
| Standard Deviation (Sample) | 2.5% | 2.4% |
| Standard Deviation (Population) | 2.5% | 2.3% |
Similar Demographics by Single Mother Households
Demographics Similar to Carpatho Rusyns by Single Mother Households
In terms of single mother households, the demographic groups most similar to Carpatho Rusyns are Immigrants from Hungary (5.7%, a difference of 0.080%), Immigrants from Malaysia (5.7%, a difference of 0.10%), Hungarian (5.7%, a difference of 0.15%), Finnish (5.7%, a difference of 0.18%), and Immigrants from Turkey (5.7%, a difference of 0.26%).
| Demographics | Rating | Rank | Single Mother Households |
| Romanians | 98.1 /100 | #77 | Exceptional 5.6% |
| Swiss | 98.1 /100 | #78 | Exceptional 5.6% |
| Immigrants | Sri Lanka | 98.0 /100 | #79 | Exceptional 5.6% |
| Czechs | 97.9 /100 | #80 | Exceptional 5.6% |
| Immigrants | Moldova | 97.9 /100 | #81 | Exceptional 5.6% |
| Immigrants | Malaysia | 97.8 /100 | #82 | Exceptional 5.7% |
| Immigrants | Hungary | 97.8 /100 | #83 | Exceptional 5.7% |
| Carpatho Rusyns | 97.7 /100 | #84 | Exceptional 5.7% |
| Hungarians | 97.6 /100 | #85 | Exceptional 5.7% |
| Finns | 97.6 /100 | #86 | Exceptional 5.7% |
| Immigrants | Turkey | 97.5 /100 | #87 | Exceptional 5.7% |
| Israelis | 97.4 /100 | #88 | Exceptional 5.7% |
| Ukrainians | 97.2 /100 | #89 | Exceptional 5.7% |
| Immigrants | Indonesia | 97.2 /100 | #90 | Exceptional 5.7% |
| Europeans | 97.0 /100 | #91 | Exceptional 5.7% |
Demographics Similar to Immigrants from Senegal by Single Mother Households
In terms of single mother households, the demographic groups most similar to Immigrants from Senegal are Pima (8.3%, a difference of 0.080%), Bahamian (8.3%, a difference of 0.24%), Jamaican (8.2%, a difference of 0.36%), Senegalese (8.2%, a difference of 0.47%), and Haitian (8.3%, a difference of 0.61%).
| Demographics | Rating | Rank | Single Mother Households |
| Immigrants | Mexico | 0.0 /100 | #314 | Tragic 8.2% |
| Immigrants | Western Africa | 0.0 /100 | #315 | Tragic 8.2% |
| Africans | 0.0 /100 | #316 | Tragic 8.2% |
| Immigrants | Honduras | 0.0 /100 | #317 | Tragic 8.2% |
| Senegalese | 0.0 /100 | #318 | Tragic 8.2% |
| Jamaicans | 0.0 /100 | #319 | Tragic 8.2% |
| Bahamians | 0.0 /100 | #320 | Tragic 8.3% |
| Immigrants | Senegal | 0.0 /100 | #321 | Tragic 8.3% |
| Pima | 0.0 /100 | #322 | Tragic 8.3% |
| Haitians | 0.0 /100 | #323 | Tragic 8.3% |
| Immigrants | Jamaica | 0.0 /100 | #324 | Tragic 8.4% |
| Immigrants | Caribbean | 0.0 /100 | #325 | Tragic 8.4% |
| British West Indians | 0.0 /100 | #326 | Tragic 8.4% |
| Immigrants | Haiti | 0.0 /100 | #327 | Tragic 8.4% |
| Yakama | 0.0 /100 | #328 | Tragic 8.4% |